. 2008 Jan;178(1):553-61.
doi: 10.1534/genetics.107.080838.

Accuracy of genomic selection using different methods to define haplotypes

Affiliations

Accuracy of genomic selection using different methods to define haplotypes

M P L Calus et al. Genetics. 2008 Jan.

Abstract

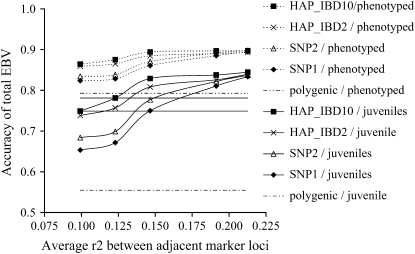
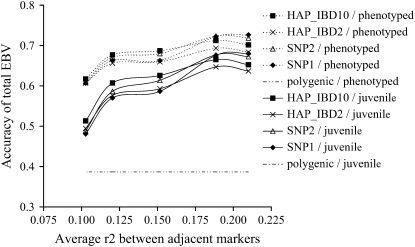
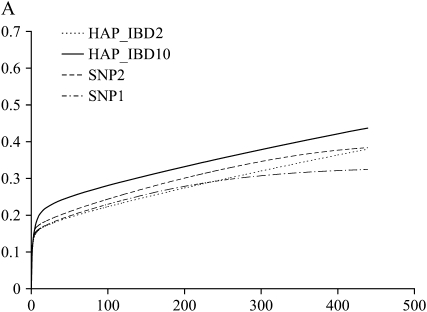
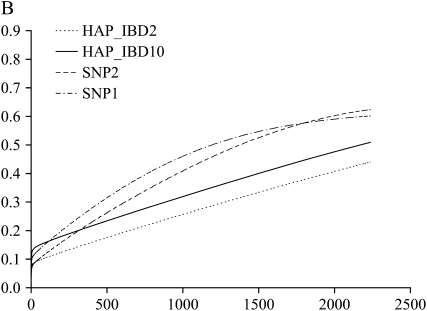
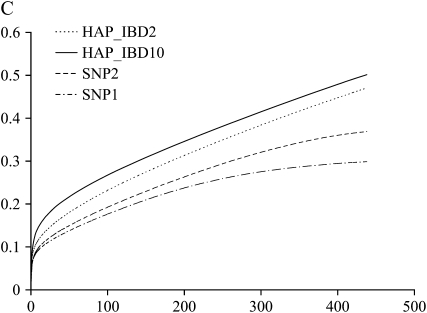
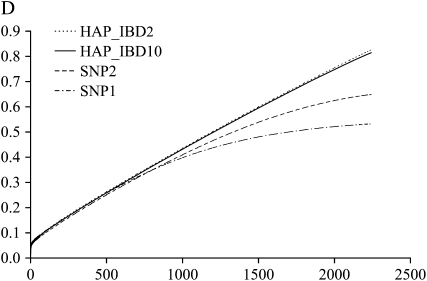
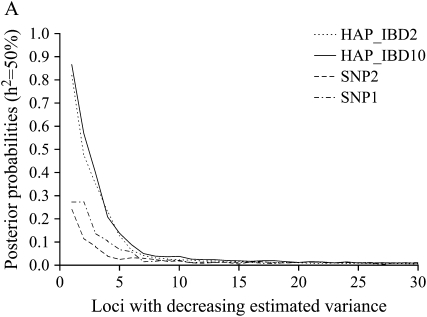
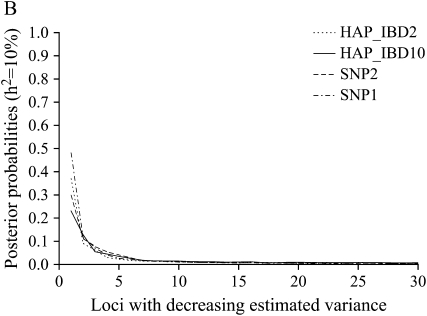
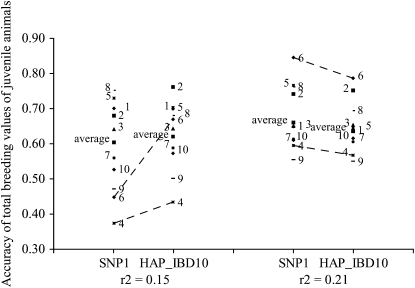
Genomic selection uses total breeding values for juvenile animals, predicted from a large number of estimated marker haplotype effects across the whole genome. In this study the accuracy of predicting breeding values is compared for four different models including a large number of markers, at different marker densities for traits with heritabilities of 50 and 10%. The models estimated the effect of (1) each single-marker allele [single-nucleotide polymorphism (SNP)1], (2) haplotypes constructed from two adjacent marker alleles (SNP2), and (3) haplotypes constructed from 2 or 10 markers, including the covariance between haplotypes by combining linkage disequilibrium and linkage analysis (HAP_IBD2 and HAP_IBD10). Between 119 and 2343 polymorphic SNPs were simulated on a 3-M genome. For the trait with a heritability of 10%, the differences between models were small and none of them yielded the highest accuracies across all marker densities. For the trait with a heritability of 50%, the HAP_IBD10 model yielded the highest accuracies of estimated total breeding values for juvenile and phenotyped animals at all marker densities. It was concluded that genomic selection is considerably more accurate than traditional selection, especially for a low-heritability trait.


Figures

F<sc>igure</sc> 1.—
Figure 1.—
Accuracies of total estimated breeding values for the high-heritability trait of phenotyped and juvenile animals estimated with the four different genomic selection models, displayed as a function of different r2-values for adjacent marker loci. Standard deviations across replicates ranged from 0.01 to 0.03 for phenotyped animals and from 0.03 to 0.08 for juvenile animals. Coordinates on the x-axis of intersections between the model curves and the solid lines indicate the required SNP LD for the different models to obtain accuracies of 0.75 and 0.78.
F<sc>igure</sc> 2.—
Figure 2.—
Accuracies of total estimated breeding values for the low-heritability trait of phenotyped and juvenile animals estimated with the four different genomic selection models, displayed as a function of different r2-values for adjacent marker loci. Standard deviations across replicates ranged from 0.01 to 0.03 for phenotyped animals and from 0.03 to 0.08 for juvenile animals.
F<sc>igure</sc> 3.—
Figure 3.—
Cumulative estimated haplotype variances, expressed as proportion of total simulated QTL variance, across loci with decreasing estimated haplotype variance for the trait with h2 = 50% and the low (A) and high (B) SNP density and for the trait with h2 = 10% and the low (C) and high (D) SNP density.
F<sc>igure</sc> 4.—
Figure 4.—
Average posterior probabilities for the 30 loci with the largest (decreasing) estimated haplotype variance for the trait with h2 = 50% (A) and h2 = 10% (B), both at the highest SNP density.
F<sc>igure</sc> 4.—
Figure 4.—
Average posterior probabilities for the 30 loci with the largest (decreasing) estimated haplotype variance for the trait with h2 = 50% (A) and h2 = 10% (B), both at the highest SNP density.
F<sc>igure</sc> 5.—
Figure 5.—
Accuracies of total estimated breeding values for the low-heritability trait of juvenile animals estimated with models SNP1 and HAP_IBD10 of all replicates with r2 between markers of 0.15 and 0.21. The dashed lines indicate differences in ranks of the models at the two marker densities for replicates 4 and 6.

Similar articles

Cited by

References

    1. Falconer, D. S., and T. F. C. Mackay, 1996. Introduction to Quantitative Genetics. Longman Group, Essex, UK.
    1. Fernando, R. L., and M. Grossman, 1989. Marker assisted selection using best linear unbiased prediction. Genet. Sel. Evol. 21: 467–477.
    1. Grapes, L., J. C. M. Dekkers, M. F. Rothschild and R. L. Fernando, 2004. Comparing linkage disequilibrium-based methods for fine mapping quantitative trait loci. Genetics 166: 1561–1570. - PMC - PubMed
    1. Grapes, L., M. Z. Firat, J. C. M. Dekkers, M. F. Rothschild and R. L. Fernando, 2006. Optimal haplotype structure for linkage disequilibrium-based fine mapping of quantitative trait loci using identity by descent. Genetics 172: 1955–1965. - PMC - PubMed
    1. Hayes, B. J., A. J. Chamberlain and M. E. Goddard, 2006. Use of markers in linkage disequilibrium with QTL in breeding programs. Proceedings of the 8th World Congress on Genetics Applied to Livestock Production, Belo Horizonte, MG, Brazil, Communication 30–06.

Publication types

Substances