. 2008 Sep;18(9):2066-76.
doi: 10.1093/cercor/bhm230. Epub 2008 Jan 17.

Do cross-modal projections always result in multisensory integration?

Affiliations

Do cross-modal projections always result in multisensory integration?

Brian L Allman et al. Cereb Cortex. 2008 Sep.

Abstract

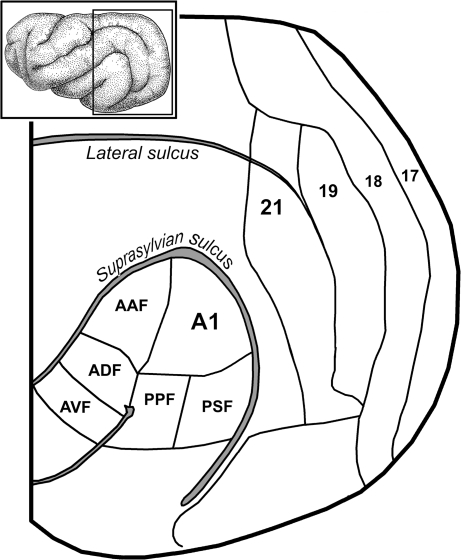
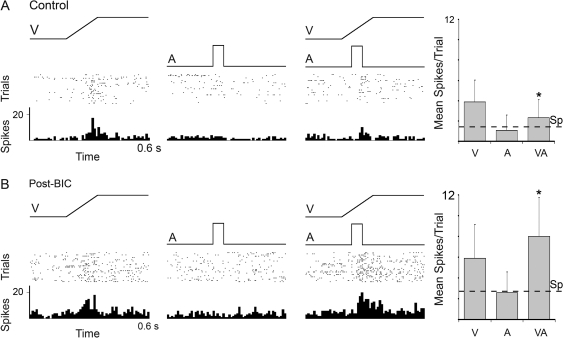
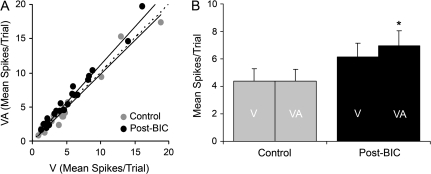
Convergence of afferents from different sensory modalities has generally been thought to produce bimodal (and trimodal) neurons (i.e., exhibit suprathreshold excitation to more than 1 sensory modality). Consequently, studies identifying cross-modal connections assume that such convergence results in bimodal (or trimodal) neurons that produce familiar forms of multisensory integration: response enhancement or depression. The present study questioned that assumption by anatomically identifying a projection from ferret auditory to visual cortex Area 21. However, electrophysiological recording within Area 21 not only failed to identify a single bimodal neuron but also familiar forms of multisensory integration were not observed either. Instead, a small proportion of neurons (9%; 27/296) showed subthreshold multisensory integration, in which visual responses were significantly modulated by auditory inputs. Such subthreshold multisensory effects were enhanced by gamma-aminobutyric acid antagonism, whereby a majority of neurons (87%; 20/23) now participated in a significant, multisensory population effect. Thus, multisensory convergence does not de facto result in bimodal (or trimodal) neurons or the traditional forms of multisensory integration. However, the fact that unimodal neurons exhibited a subthreshold form of multisensory integration not only affirms the relationship between convergence and integration but also expands our understanding of the functional repertoire of multisensory processing itself.


Figures

Figure 1.
Figure 1.
Visual and auditory areas of the ferret cerebral cortex. The inset shows a lateral view of the ferret cortex with the boxed region enlarged below. Cradled within the bend of the suprasylvian sulcus are the auditory cortices, which include the AAF, ADF, anterior ventral field (AVF), A1, PPF, and the PSF (after Bizley et al. 2005). Progressing anteriorly from the occipital pole are the retinotopically organized visual Areas 17, 18, 19, and 21 (after Manger et al. 2002).
Figure 2.
Figure 2.
Orthogradely labeled auditory boutons in visual Area 21 (A) and retrogradely labeled neurons in auditory cortex (B). In (A), the micrograph shows a network of labeled axons with terminal as well as boutons in passage in visual Area 21. These orthogradely labeled processes resulted from tracer injections focused on auditory area A1. In (B), tracer injection into visual Area 21 produced retrogradely labeled pyramidal neurons in auditory cortex. Scale bars = 10 μm.
Figure 3.
Figure 3.
Orthograde projections from auditory to visual cortex. In each of 3 cases, tracer injection into and around primary auditory cortex produced labeled axons and boutons (each dot = 1 bouton) in the visual area surrounding the lateral suclus (LS) designated Area 21 (Manger et al. 2002). The insets show lateral views of the ferret cortex and the sites of injection for each case; vertical lines indicate location of the coronal sections expanded to the right. The coronal sections, arranged serially from anterior (left) to posterior (right) display the injection sites (gray areas) as well as the locations of labeled boutons. In each case, the density of labeled boutons was highest anteriorly and diminished at more posterior levels. The last section to the right indicates the most posterior level at which labeled boutons were found. Scale bar = 1 mm.
Figure 4.
Figure 4.
Auditory cortical source of projections to visual cortex. The inset shows the lateral view of the ferret cortex with the auditory cortical divisions outlined (dashed lines) and the visual cortical injection site (gray area) in and surrounding the lateral sulcus. Vertical lines indicate the levels from which the expanded coronal sections (anterior-left to posterior-right) are taken. Each black dot represents the location of 1 neuron retrogradely labeled from the Area 21 injection site (gray area on far right). Retrogradely labeled neurons were primarily found in association with the dorsal and posterior aspects of A1. SS, suprasylvian sulcus; LS, lateral sulcus. Scale bar = 1 mm.
Figure 5.
Figure 5.
Recording sites through visual Area 21. Schematic (far right) of the lateral view of the ferret cortex shows the levels (anterior-left to posterior-right) from which the coronal sections containing 19 recording penetrations were taken. Along a given penetration, each dash indicates a recording site where visual neurons were found and tested using qualitative and quantitative single- and combined-modality sensory stimulation. LS, lateral sulcus. Scale bar = 1 mm.
Figure 6.
Figure 6.
Cross-modal projections terminated in the area of recording penetrations. In an animal that received an auditory cortical tracer injection prior to recording, orthogradely labeled axons terminals and boutons (fine black wavy lines and dots, respectively) were present in the same cortical location as a recording electrode track (long black line overlying tissue damage). Visual neurons were found at each dash on the recording penetration. Note that labeled boutons were found on both sides of the recording track, indicating that the penetration occurred in close proximity to the termination of the cross-modal projection. A and B refers to recording sites for the neuronal responses shown in the next figure (Fig. 7).
Figure 7.
Figure 7.
Responses of Area 21 visual neurons to visual, auditory, and combined visual–auditory stimuli. For 2 representative neurons (marked A and B in Fig. 6), responses to a visual stimulus (ramp labeled “V”), auditory stimulus (square wave labeled A), and combined stimuli (VA) are shown in the rasters (dot = 1 spike; each row = 1 trial) and histograms (10-ms time bins). For both neurons, the visual stimulus elicited a robust response, whereas the auditory stimulus was ineffective. When these same visual and auditory stimuli were combined, the responses of these neurons were not significantly changed from the visual alone condition, as shown in the respective bar graphs (mean spikes/trial ± SD). Spontaneous activity is indicated by the dashed line (Sp).
Figure 8.
Figure 8.
Comparison of responses of Area 21 neuron population to visual and combined visual–auditory stimuli. (A) For the 296 neurons examined, this graph plots the relationship of neuronal responses (mean spikes/trial) to the visual stimulus alone (V; x-axis) to those evoked by the combined auditory and visual stimuli (VA; y-axis). Most responses fell on or near the line of unity, with a similar number either slightly above (48%; 142/296) or below (52%; 154/296), suggesting that the auditory stimuli had no net effect on the population. (B) The bar graph shows the population (n = 296) response average of the mean spikes/trial (±SEM) to the visual alone (V) and to the combined visual–auditory stimulation (VA), which were not significantly different (P = 0.38, paired t-test).
Figure 9.
Figure 9.
Effect of blockade of local inhibition on an Area 21 visual neuron in response to visual, auditory, and combined visual–auditory stimulation. (A) The neuron responded (rasters: dot = 1 spike; each row = 1 trial; histograms: 10-ms time bins) to a visual stimulus (ramp labeled V) but not to an auditory stimulus (square wave labeled A). When the 2 stimuli were combined (VA), the visual response of the neuron was noticeably reduced. These responses are summarized in the bar graphs (far right), where it is evident that the response (mean spikes/trial ± SD) to the combined response was significantly reduced (paired t-test, P < 0.05, *). (B) The identical tests were repeated in the same neuron, but this time after the ejection of the GABAergic antagonist BIC. When GABAergic inhibition was blocked, this neuron remained unresponsive to the auditory stimulus but showed significant levels of response facilitation to the combined visual–auditory stimulation (paired t-test, P < 0.05, *). Spontaneous activity is indicated by the dashed line (Sp).
Figure 10.
Figure 10.
Comparison of responses of Area 21 neurons to visual and combined visual–auditory stimuli before and after inhibitory blockade with BIC. (A) For the 23 neurons tested, this graph plots the responses (mean spikes/trial) to the visual stimulus alone (V; x-axis) versus those evoked by the combined auditory–visual stimuli (VA; y-axis) under control (light gray symbols) and post-BIC ejection conditions (black symbols). For the control condition, most responses fell on or near the line of unity (dashed line). However, when inhibition was blocked, 4/23 neurons showed significant levels of response facilitation and 87% (20/23) had responses that fell above the line of unity. Regression lines are plotted for the control and post-BIC conditions. (B) The bar graph shows the population (n = 23) response average of the mean spikes/trial (±SEM) to the V and combined condition VA for control (gray) and post-BIC conditions (black). Note that when GABAergic inhibition was blocked, there was a significant difference in the response to visual and combined visual–auditory stimulation (paired t-test, P < 0.001, *).

References

    1. Adey WR, Noda H. Influence of eye movements on geniculo-striate excitability in the cat. J Physiol. 1973;235:805–821. - PMC - PubMed
    1. Allman BL, Meredith MA. Multisensory processing in ‘unimodal’ neurons: cross-modal subthreshold auditory effects in cat extrastriate visual cortex. J Neurophysiol. 2007;98:545–549. - PubMed
    1. Barraclough NE, Xiao D, Baker CI, Oram MW, Perrett DI. Integration of visual and auditory information by superior temporal sulcus neurons responsive to the sight of actions. J Cog Neurosci. 2005;17:377–391. - PubMed
    1. Bavelier D, Neville HJ. Cross-modal plasticity: where and how? Nature Rev Neurosci. 2002;3:443–452. - PubMed
    1. Bell AH, Corneil BD, Munoz DP, Meredith MA. Engagement of visual fixation suppresses sensory responsiveness and multisensory integration in the primate superior colliculus. Eur J Neurosci. 2003;18:2867–2873. - PubMed

Publication types

MeSH terms