. 2008 Mar;36(5):1429-42.
doi: 10.1093/nar/gkm1116. Epub 2008 Jan 18.

Transcription regulation of the type II restriction-modification system AhdI

Affiliations

Transcription regulation of the type II restriction-modification system AhdI

Ekaterina Bogdanova et al. Nucleic Acids Res. 2008 Mar.

Abstract

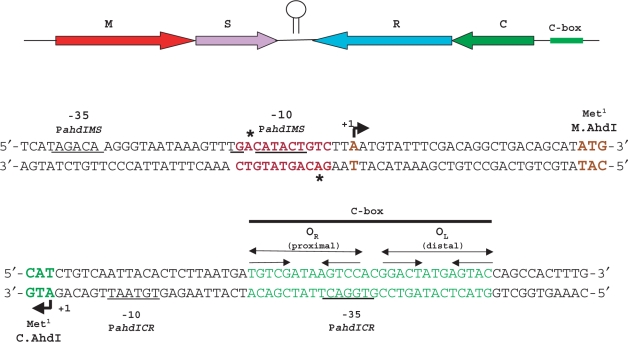
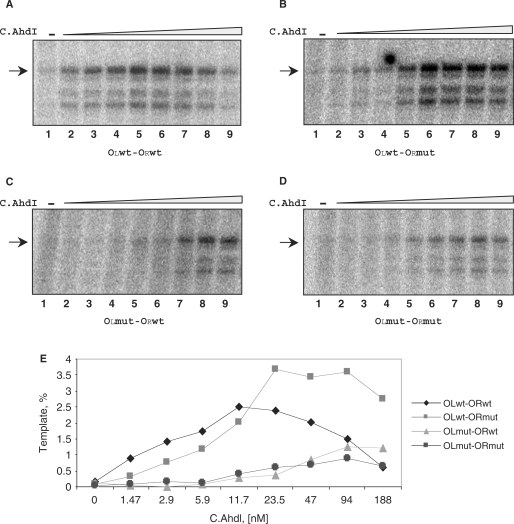
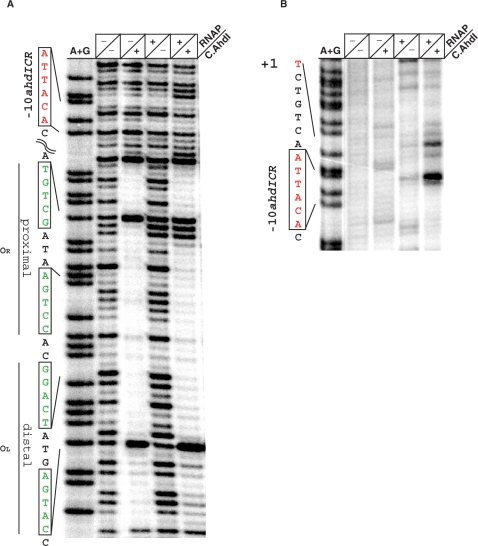
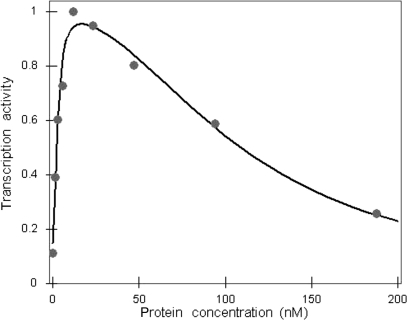
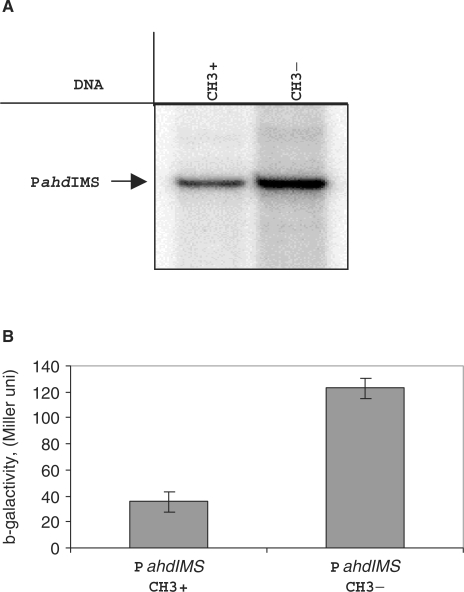
The Restriction-modification system AhdI contains two convergent transcription units, one with genes encoding methyltransferase subunits M and S and another with genes encoding the controller (C) protein and the restriction endonuclease (R). We show that AhdI transcription is controlled by two independent regulatory loops that are well-optimized to ensure successful establishment in a naïve bacterial host. Transcription from the strong MS promoter is attenuated by methylation of an AhdI site overlapping the -10 element of the promoter. Transcription from the weak CR promoter is regulated by the C protein interaction with two DNA-binding sites. The interaction with the promoter-distal high-affinity site activates transcription, while interaction with the weaker promoter-proximal site represses it. Because of high levels of cooperativity, both C protein-binding sites are always occupied in the absence of RNA polymerase, raising a question how activated transcription is achieved. We develop a mathematical model that is in quantitative agreement with the experiment and indicates that RNA polymerase outcompetes C protein from the promoter-proximal-binding site. Such an unusual mechanism leads to a very inefficient activation of the R gene transcription, which presumably helps control the level of the endonuclease in the cell.


Figures

Figure 1.
Figure 1.
Structural organization of the AhdI restriction-modification system. The ahdI genes are schematically shown on the top. Arrows show the direction of transcription. Two ahdI transcription units (MS and CR) are separated by a short self-complementary region that may act as a bidirectional transcription terminator (depicted here as a hairpin). DNA sequences around transcription start points of the ahdIMS and ahdICR promoters are expanded below. Beginnings of coding regions are indicated with colours that match those at the top of the figure. The PahdIMS and PahdICR start sites are shown, respectively, by rightward and leftward arrows above and below the sequence. Promoter elements are underlined and transcription starts are colour-coded. The ahdI C-box is indicated and two sets of inverted repeats are shown by convergent arrows. The AhdI site in front of PahdIMS is indicated in red; astericks indicate methylated adenine residues. The start codons of ahdC and ahdIM are indicated.
Figure 2.
Figure 2.
Expression of the ahdI genes in vivo. (A) The horizontal lines show overnight 37°C growth of E. coli Z85 strain harbouring indicated plasmids on an LB agar plate. Cells were spotted with indicated dilutions of λ-vir phage lysate. (B and C) Primer extension analysis of ahdI transcripts. RNA was purified from E. coli Z85 strain harbouring wild-type AhdI plasmid pAhdIRM (lanes 1) or pAhdIRM derivative with disrupted ahdIC (lanes 2) and primer extension reactions were performed with oligonucleotide primers complementary to the ahdIC (Figure 2B) and ahdIM (Figure 2C) genes. Sequencing reactions marker lanes were prepared with pAhdIRM and primers used for primer extension.
Figure 3.
Figure 3.
Analysis of C.AhdI complexes on the wild-type and mutant ahdICR promoters using electrophoretic mobility shift assay. (A) Sequences of the wild-type and mutant C-boxes are presented. Two sets of inverted repeats that form promoter-proximal (OR) and promoter-distal (OL) C.AhdI-binding sites are highlighted in green colour. Promoter elements and transcription start site of the ahdICR promoter are also indicated. Substitutions introduced in mutant ahdI fragments are highlighted in red. (BI) Increasing concentrations of the wild-type (panels B–E) or mutant (panels F–I) C.AhdI were combined with 20 nM of the indicated AhdI C-box DNA fragments, complexes were allowed to form and separated by EMSA. Results of electrophoretic separation of reaction products on an 8% native polyacrylamide gel are shown. F—free DNA, D—complexes containing bound C.AhdI dimer, T—complexes containing two C.AhdI dimers.
Figure 4.
Figure 4.
DNase I footprinting of C.AhdI complexes on wild-type and mutant ahdICR promoters. 32P-end labelled (bottom strand) ahdICR promoter-containing fragments (22.5 nM) were combined with increasing concentrations (0–188 nM) of C.AhdI and treated with DNase I. Two sets of inverted repeats are indicated at the left of each panel.
Figure 5.
Figure 5.
In vitro transcription from wild-type and mutant ahdICR promoters. (AD) E. coli RNAP σ70 holoenzyme (100 nM) was combined with DNA fragments containing wild-type or mutant PahdICR (8 nM) in the presence of increasing concentrations of C.AhdI (0–500 nM) and a single-round transcription reaction was performed. Reaction products were separated by denaturing gel electrophoreses. (E) Quantification of results presented in (A).
Figure 6.
Figure 6.
Footprinting of RNA polymerase complexes PahdICR. The indicated proteins were combined with the wild-type PahdICR DNA fragment, complexes were allowed to form and footprinted with DNase I (A) or probed with KMnO4 (B). C.AhdI binding sites and the −10 element of the promoter are indicated.
Figure 7.
Figure 7.
Modelling transcription activity of PahdICR versus C.AhdI protein concentration. Experimentally measured values of the transcription activity for the wild-type operator sequence are given by the grey circles. The transcription activities are measured in arbitrary units, so the transcription activity values are normalized such that the maximal value corresponds to one. The curve obtained by fitting the quantitative model to the experimental points is shown by the black line.
Figure 8.
Figure 8.
Regulation the PahdIMS activity in vitro and in vivo. (A) A single-round transcription in vitro by E.coli RNAP σ70 holoenzyme (100 nM) from regulatory region DNA fragment (13 nM) containing methylated and unmethylated promoter region were performed and products were separated by gel electrophoreses. Autoradiographs of 8% denaturing polyacrylamide gels are shown. (B) Effect of methylation on the expression of ahdIM gene. Plasmid pPM containing transcriptional fusion PahdIM’::’lacZ were co-transformed with the pAhdIMRinC plasmid (only methylase gene is active), bacterial cultures were grown until OD600 0.5 and β-galactosidase activity was measured in three independent sets of experiments.
Figure 9.
Figure 9.
Modelling of AhdI system dynamics. (A) Equilibrium position for C.AhdI. The black line presents transcription activity versus protein concentration. The equilibrium is determined by the intersection of the black dashed line with the transcription activity curve, and the equilibrium protein concentration is indicated by the vertical grey dashed line. Parameter values used for C.AhdI are: the maximal value of the transcription rate for PahdICR is 1 nM/min, protein and transcript half-lives are 30 min and 5 min, respectively, and C.AhdI transcript is translated three times during its lifetime. (B) Dynamics of equilibrium establishment for R.AhdI and M.AhdI. Values on the vertical axis give protein concentration scaled by the equilibrium value, while the horizontal axis corresponds to time post-plasmid entry. The full and dashed lines correspond, respectively, to the change of the protein concentrations with time for R.AhdI and M.AhdI. For R.AhdI we use five times larger translation rate compared to C.AhdI, while other parameters are the same. For M.AhdI KD = 650 nM, while the other parameters are the same as for R.AhdI.

References

    1. Jeltsch A, Pingoud A. Horizontal gene transfer contributes to the wide distribution and evolution of type II restriction-modification systems. J. Mol. Evol. 1996;42:91–96. - PubMed
    1. Kobayashi I. Behavior of restriction-modification systems as selfish mobile elements and their impact on genome evolution. Nucleic Acids Res. 2001;29:3742–3756. - PMC - PubMed
    1. Streeter SD, Papapanagiotou I, McGeehan JE, Kneale GG. DNA footprinting and biophysical characterization of the controller protein C.AhdI suggests the basis of a genetic switch. Nucleic Acids Res. 2004;32:6445–6453. - PMC - PubMed
    1. Ives CL, Nathan PD, Brooks JE. Regulation of the BamHI restriction-modification system by a small intergenic open reading frame, bamHIC, in both Escherichia coli and Bacillus subtilis. J. Bacteriol. 1992;174:7194–7201. - PMC - PubMed
    1. Anton BP, Heiter DF, Benner JS, Hess EJ, Greenough L, Moran LS, Slatko BE, Brooks JE. Cloning and characterization of the BglII restriction-modification system reveals a possible evolutionary footprint. Gene. 1997;187:19–27. - PubMed

Publication types

MeSH terms

Substances