. 2008 Mar;80(3):547-56.
doi: 10.1002/jmv.21091.

Defining the levels of secreted non-structural protein NS1 after West Nile virus infection in cell culture and mice

Affiliations

Defining the levels of secreted non-structural protein NS1 after West Nile virus infection in cell culture and mice

Kyung Min Chung et al. J Med Virol. 2008 Mar.

Abstract

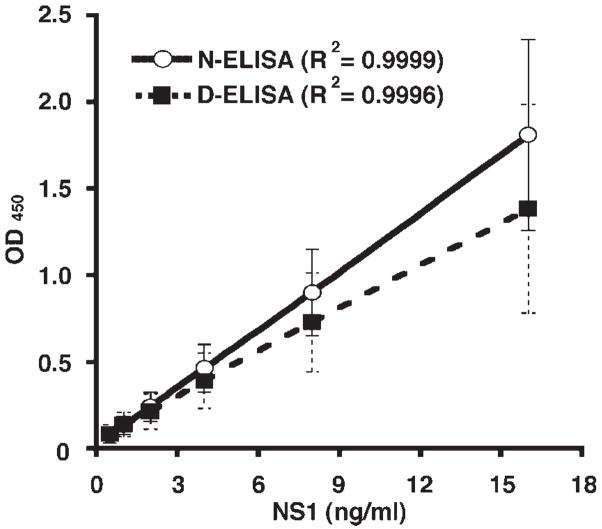
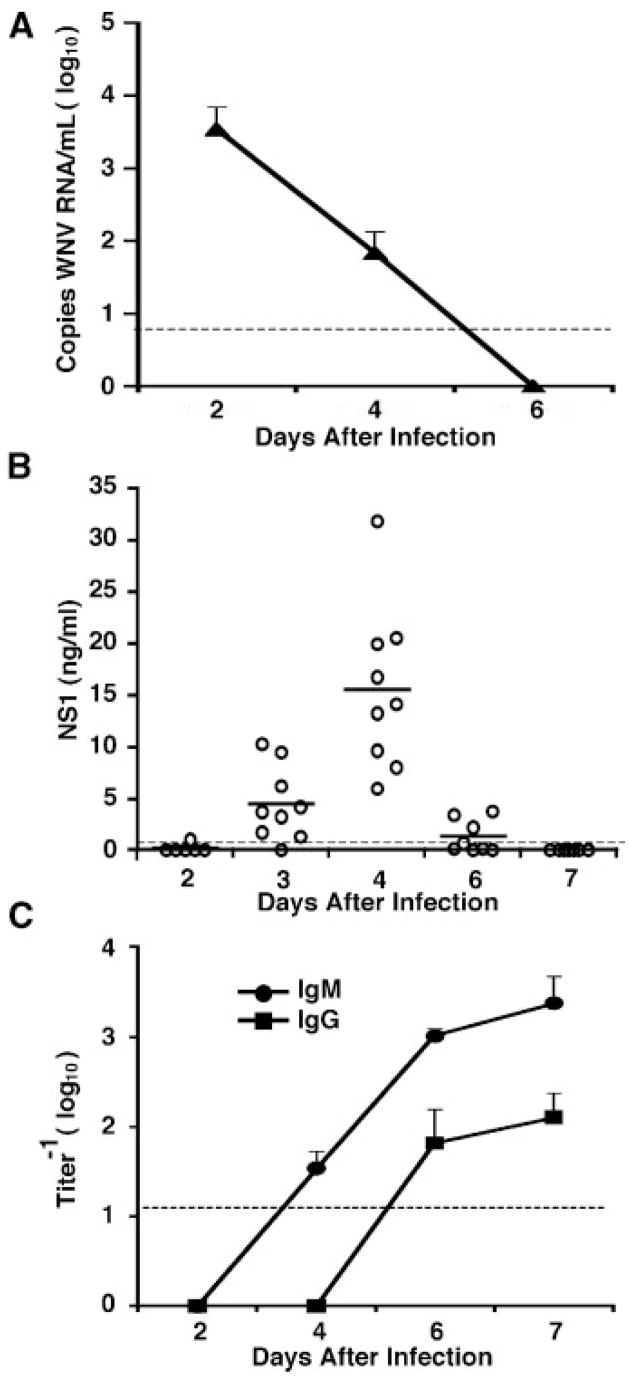
Infection with West Nile virus (WNV) causes a febrile illness that can progress to meningitis or encephalitis, primarily in humans that are immunocompromised or elderly. For successful treatment of WNV infection, accurate and timely diagnosis is essential. Previous studies have suggested that the flavivirus non-structural protein NS1, a highly conserved and secreted glycoprotein, is a candidate protein for rapid diagnosis. Herein, we developed a capture enzyme-linked immunosorbent assay (ELISA) to detect WNV NS1 using two anti-NS1 monoclonal antibodies (mAbs) that map to distinct sites on the protein. The capture ELISA efficiently detected as little as 0.5 ng/ml of soluble NS1 and exhibited no cross-reactivity for yellow fever, Dengue, and St. Louis encephalitis virus NS1. The capture ELISA reliably detected NS1 in plasma at day 3 after WNV infection, prior to the development of clinical signs of disease. As the time course of infection continued, the levels of detectable NS1 diminished, presumably because of interference by newly generated anti-NS1 antibodies. Indeed, treatment of plasma with a solution that dissociated NS1 immune complexes extended the window of detection. Overall, the NS1-based capture ELISA is a sensitive readout of infection and could be an important tool for diagnosis or screening small molecule inhibitors of WNV infection.


Figures

Fig. 1
Fig. 1
WNV NS1 capture ELISA. NS1 capture ELISA dose–response curve with different concentrations of untreated (N-ELISA; solid line) or alkaline-treated (D-ELISA; dashed lines) purified NS1. Untreated or alkaline-treated NS1 was diluted serially and added to 10NS1-coated plates, washed, and detected with biotinylated 3NS1. The graph represents the average results of four independent experiments performed in duplicate. Error bars indicate standard deviations. The R2 values of the linear regressions are indicated.
Fig. 2
Fig. 2
Detection of NS1 from WNV-infected BHK and primary cells. A: Quantitation of NS1 from WNV-infected BHK cells. BHK cells were infected with lineage I (Lin I, New York 1999) or lineage II (Lin II, 956) WNV strains at an MOI of 0.1, 0.5, 1, 2.5, or 12.5. The culture media were collected at 6, 12, 24, and 48 hr after infection and measured by NS1 capture ELISA. The graph shows the average results of two independent experiments performed in duplicate. Note the break in the y-axis. B: Detection of secreted NS1 from WNV-infected mouse primary cells. Primary cortical neurons (neuron), BM-DC (DC), and BM-Mφ (Mφ) were infected with WNV (Lin I) at an MOI of 0.01 and extensively washed. At 72 hr after infection, NS1 was quantitated by capture ELISA. In parallel, infectious virus in culture fluid was measured by plaque assay on BHK cells. Each dot and black bar represents viral titers and NS1 concentrations at each point. The graph shows the average results of two independent experiments. Error bars indicate standard deviations. The concentration of NS1 was calculated after comparison with a standard curve, which was performed on each ELISA plate.
Fig. 3
Fig. 3
Flow cytometry analysis of cross-reactivity of 3NS1 and 10NS1 mAb against flaviviruses. BHK cells were infected with DENV, YFV, SLEV, and WNV at an MOI of 0.2. Immunoreactivity of 3NS1 and 10NS1 mAb was analyzed in saponin-permeablized cells. The cross-reactive 4G2 mAb against flavivirus E was used as a positive control and uninfected BHK cells were used as negative control. Arrows indicate that the binding of mAbs to NS1. The data is representative of two independent experiments.
Fig. 4
Fig. 4
Viremia, quantitation of NS1 in plasma, and titers of IgM and IgG against WNV NS1. Five-week-old wild type mice were infected with 2 × 10⁵ PFU of WNV, and serum or plasma was collected at the indicated days. A: WNV RNA levels in the serum were determined by quantitative RT-PCR. The data reflects 5 mice per time point. B: After infection with 2 × 10⁵ PFU of WNV, plasma samples were collected at days 2, 3, 4, 6, and 7. The level of NS1 in plasma was analyzed by capture ELISA without dissociation of immune complexes. Each circle represents a sample from an individual mouse. Solid dashes denote the average NS1 concentration at each time point. The concentration of NS1 was calculated after comparison with a standard curve, which was performed on each ELISA plate. C: Titers of anti-NS1 specific IgM and IgG were determined after incubation of plasma with purified WNV NS1 adsorbed to microtiter plates. In a subset of samples, low levels of anti-NS1 IgM were detected at day 3 after infection (data not shown). The data reflects at least 4 mice per time point. The dotted line represents the limit of sensitivity of the assay. Error bars indicate standard deviations.
Fig. 5
Fig. 5
Release of NS1 from NS1-antibody immune complexes. After preparation of NS1-antibody immune complexes, soluble NS1 was detected by capture ELISA with (D-ELISA; filled bar) or without (N-ELISA; open bar) dissociation of immune complexes. The difference in the level of NS1 between the D-ELISA and N-ELISA was statistically significant (asterisks) at two different serum dilutions (1:2,000, P = 0.0002; 1:100, P = 0.002). Error bars indicate standard deviations. The dashed line indicates the limit of sensitivity.
Fig. 6
Fig. 6
Comparison of detection of WNV NS1 levels in plasma samples with or without dissociation of immune complexes. Wild type mice were infected with 2 × 10⁵ PFU of WNV and plasma samples were collected at days 3, 4, 6, and 7. The level of NS1 in plasma was measured by capture ELISA with (D-ELISA; filled circle) or without (N-ELISA; open circle) dissociation of immune complexes. The increase in the level of NS1 after dissociation of immune complex was significant at the following days: day 4, P < 0.0001; day 6, P = 0.02; and day 7, P = 0.03. Each circle and line represents one pair of samples from an individual mouse with or without immune complex dissociation. The solid dashed line indicates the limit of sensitivity. Asterisks indicate time points at which difference are statistically significant. The number of mice for each time point ranged from 6 to 10 from 2 to 3 independent experiments. The concentration of NS1 was calculated after comparison with a standard curve, which was performed on each ELISA plate.

Similar articles

Cited by

References

    1. Agrawal AG, Petersen LR. Human immunoglobulin as a treatment for West Nile virus infection. J Infect Dis. 2003;188:1–4. - PubMed
    1. Alcon S, Talarmin A, Debruyne M, Falconar A, Deubel V, Flamand M. Enzyme-linked immunosorbent assay specific to Dengue virus type 1 nonstructural protein NS1 reveals circulation of the antigen in the blood during the acute phase of disease in patients experiencing primary or secondary infections. J Clin Microbiol. 2002;40:376–381. - PMC - PubMed
    1. Ben-Nathan D, Lustig S, Tam G, Robinzon S, Segal S, Rager-Zisman B. Prophylactic and therapeutic efficacy of human intravenous immunoglobulin in treating west nile virus infection in mice. J Infect Dis. 2003;188:5–12. - PubMed
    1. Brinton MA. The molecular biology of West Nile Virus: A new invader of the western hemisphere. Annu Rev Microbiol. 2002;56:371–402. - PubMed
    1. Busch MP, Caglioti S, Robertson EF, McAuley JD, Tobler LH, Kamel H, Linnen JM, Shyamala V, Tomasulo P, Kleinman SH. Screening the blood supply for West Nile virus RNA by nucleic acid amplification testing. N Engl J Med. 2005a;353:460–467. - PubMed

Publication types