. 2008 Jun;124(2):166-74.
doi: 10.1111/j.1365-2567.2007.02750.x. Epub 2008 Jan 16.

Heterogeneity of lymphoid tissue inducer cell populations present in embryonic and adult mouse lymphoid tissues

Affiliations

Heterogeneity of lymphoid tissue inducer cell populations present in embryonic and adult mouse lymphoid tissues

Mi-Yeon Kim et al. Immunology. 2008 Jun.

Abstract

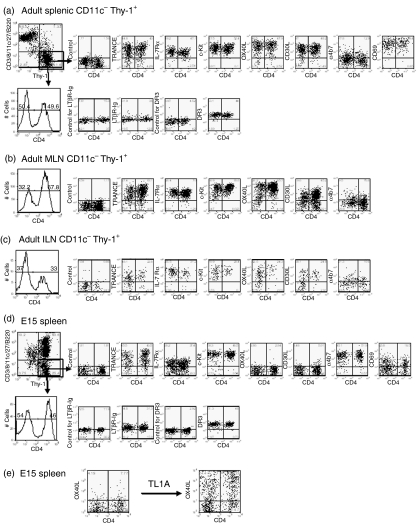
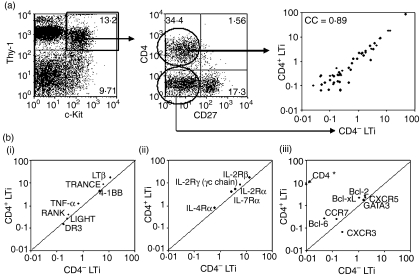
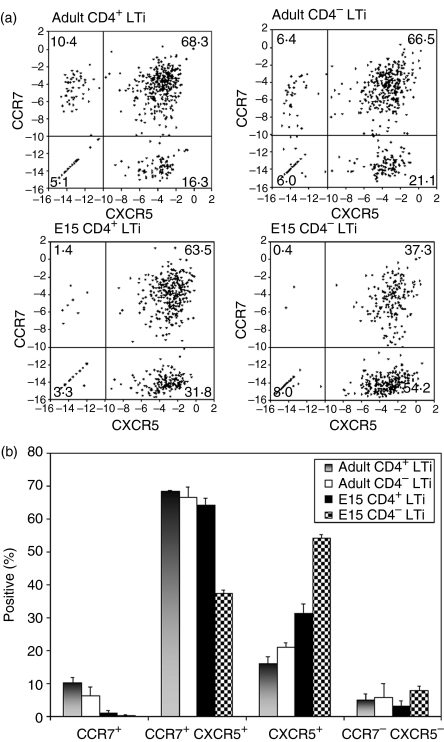
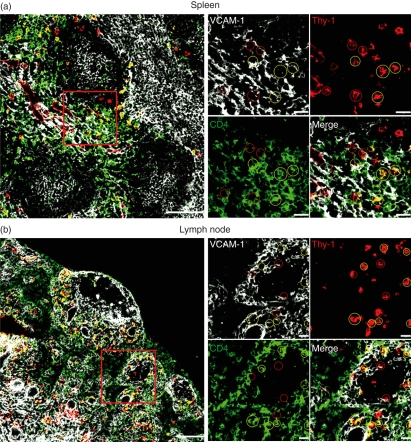
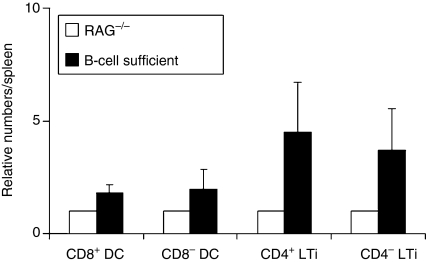
Lymphoid tissue inducer (LTi) cells have a well established role in secondary lymphoid tissue development. Here, we report on the heterogeneity of LTi cells based on their CD4 and chemokine receptor expression. The CD4(-) LTi-cell population has a similar phenotype to the CD4(+) population, with similar chemokine-receptor-expressing subsets. In both embryonic and adult spleen the CD4(-) LTi-cell population is comparable as a proportion of total splenocytes to its CD4(+) counterpart. In contrast, different proportions of CD4(+) and CD4(-) LTi cells are found in different lymph nodes. Both CD4(+) and CD4(-) LTi cells share the anatomical location and are associated with vascular cell adhesion molecule-1-positive stromal cells in spleen and lymph nodes. The numbers of both CD4(+) and CD4(-) LTi cells in adult spleen are augmented in the presence of B cells. With the exception of CD4, there is a strong correlation coefficient (0.89) for gene expression between the two populations. Polymerase chain reaction analysis of individual CD4(+) and CD4(-) LTi cells shows that a similar proportion in embryonic and adult spleen co-expressed both CXCR5 and CCR7 or CXCR5 alone: 84.6% for adult CD4(+) and 87.6% for adult CD4(-); 95.3% for embryonic CD4(+) and 91.5% for embryonic CD4(-). Consistently fewer CCR7 single-positive cells were found in the CD4(+) and CD4(-) fractions in the embryo.


Figures

Figure 1
Figure 1
Phenotype of CD4+ and CD4 lymphoid tissue inducer (LTi) cells from adult and E15 spleens. (a–c) CD11c-depleted and Thy-1-enriched population from adult T-cell-deficient mouse spleens (a), mesenteric lymph nodes (b) and inguinal lymph nodes (c). (d) Embryonic (E15) splenocytes from wild-type mice cultured with interleukin-7 (IL-7) for 1 week. The results are representative of at least five separate experiments. For LTβR-Ig staining adult CD11c Thy-1+ cells were cultured with IL-7 for 1 week. To test IL-7Rα surface expression, E15 spleens cultured with IL-7 were transferred into IL-7-free medium for 1 day before staining. (e) Upregulation of OX40L expression on E15 CD4+ and CD4 LTi cells after 2 days culture with 100 ng/ml TL1A. The results are representative of at least 10 separate experiments.
Figure 2
Figure 2
Correlation between gene expressions in CD4+ and CD4 lymphoid tissue inducer (LTi) cells isolated from wild-type E15 spleens. (a) CD4+ LTi (Thy-1+ CD4+ c-Kit+ CD27) and CD4 LTi (Thy-1+ CD4c-Kit+ CD27) cells from wild-type E15 spleens were MoFlo-sorted and analysed their mRNA expressions by TaqMan 96-gene arrays for a panel of immunity-related genes (see Materials and methods). Over 0·01% expression of individual genes compared with β-actin mRNA signals (β-actin signal = 100%) was plotted. If the mRNA signal of a gene showed < 0·01% of β-actin signals, the gene was excluded from the plot. x and y axes show relative levels of mRNA expression of the two cell types being correlated by β-actin signals (β-actin signal = 100%). Correlation coefficient (CC) between CD4+ and CD4 LTi cells is 0·89. (b) Expression of (i) tumour necrosis factor (TNF) ligands and TNF receptors, (ii) common γ-chain cytokine receptors, and (iii) chemokine receptors, Bcl-2 family members, GATA, and CD4 in E15 CD4+ and CD4 LTi cells. * mRNA signals of CD4 in CD4 LTi cells were not detectable (below 0·01% of β-actin signals). Cross line inside graph indicates CC = 1.
Figure 3
Figure 3
Single-cell polymerase chain reaction for the expression of CCR7 and CXCR5 in CD4+ and CD4 lymphoid tissue inducer (LTi) cells isolated from adult T-cell-deficient but B-cell-sufficient spleens and wild-type E15 spleens. (a) Expression of CXCR5 and CCR7 in 492 adult CD4+ LTi, 516 adult CD4 LTi, 488 E15 CD4+ LTi, and 485 E15 CD4 LTi cells. The expression of CXCR5 (x axis) was plotted against CCR7 (y axis) after normalization to β2-microglobulin (β2m) signals [Ct value of β2m –Ct value of chemokine receptor (log 2)]. Each dot indicates the gene expression of a single cell. For each population, 525 total single cells were MoFlo-sorted in three separate plates (175 cells/plate). (b) Percentage of CCR7+ CXCR5, CCR7+ CXCR5+, CCR7 CXCR5+, and CCR7 CXCR5 cells in four LTi populations from the three separate experiments. Error bar shows the standard deviation.
Figure 4
Figure 4
Both CD4+ and CD4 lymphoid tissue inducer (LTi) cells interact with vascular cell adhesion molecule 1-positive (VCAM-1+) stroma in the spleen and lymph node. Spleen (a) and mesenteric lymph node (b) from T-cell-deficient mice stained for expression of VCAM-1 (white), Thy-1 (red) and CD4 (green). CD4+ LTi cells are indicated in yellow circles, and CD4 LTi cells in red circles. Left-hand panels show low-power image, scale bar represents 100 μm; right-hand panels show high-power image of demarcated area, scale bar represents 20 μm.
Figure 5
Figure 5
Development of embryonic CD4+ and CD4 lymphoid tissue inducer (LTi) cells by interleukin-7 (IL-7). E15 spleens were organ cultured with or without IL-7 up to 7 days and stained for α4 β7, lineage marker (lin; CD3, CD8, CD11c, CD27, and B220), CD4 and Thy-1. The α4 β7+ lin cells were gated. The results are representative of at least three separate experiments.
Figure 6
Figure 6
Relative cell numbers of adult CD8+ DCs, CD8 DCs, CD4+ and CD4 lymphoid tissue inducer (LTi) cells in B-cell-sufficient mice to RAG−/− mice. Age- and sex-matched RAG−/− (CD45.2) and B-cell-sufficient (CD45.1) adult mouse spleens were mixed and prepared for the isolation of the cells. The mixed cells were distinguished by allotypic marker, CD45. CD11c-enriched population was stained for CD45.1, CD11c, and CD8 (CD45.1+ CD11c+ CD8+ = CD8+ DCs and CD45.1+ CD11c+ CD8 = CD8 DCs from B-cell-sufficient mouse, and CD45.1 CD11c+ CD8+ = CD8+ DCs and CD45.1 CD11c+ CD8 = CD8 DCs from RAG−/− mouse). CD11c-depleted and Thy-1-enriched population was stained for CD45.1, Thy-1, CD4, and all lineage (lin) makers (CD45.1+ Thy-1+ CD4+ lin = CD4+ LTi and CD45.1+ Thy-1+ CD4 lin = CD4 LTi cells from B-cell-sufficient mouse, and CD45.1 Thy-1+ CD4+ lin = CD4+ LTi and CD45.1 Thy-1+ CD4 lin = CD4 LTi cells from RAG−/− mouse). The relative cell number of each population from B-cell-sufficient mouse was corrected to that from RAG−/− mouse (the cell number of each population from RAG−/− mouse is 1). The results are the average of five separate experiments and error bar shows the standard deviation.

References

    1. Mebius RE. Organogenesis of lymphoid tissues. Nat Rev Immunol. 2003;3:292–303. - PubMed
    1. Cupedo T, Mebius RE. Cellular interactions in lymph node development. J Immunol. 2005;174:21–5. - PubMed
    1. Kim MY, Gaspal FM, Wiggett HE, et al. CD4(+)CD3(−) accessory cells costimulate primed CD4 T cells through OX40 and CD30 at sites where T cells collaborate with B cells. Immunity. 2003;18:643–54. - PubMed
    1. Kim MY, McConnell FM, Gaspal FM, et al. Function of CD4 + CD3− cells in relation to B- and T-zone stroma in spleen. Blood. 2007;109:1602–10. - PubMed
    1. Lane PJ, Gaspal FM, Kim MY. Two sides of a cellular coin: CD4(+)CD3− cells regulate memory responses and lymph-node organization. Nat Rev Immunol. 2005;5:655–60. - PMC - PubMed

Publication types