Comparative Study
. 2008 Jan 18:9:21.
doi: 10.1186/1471-2164-9-21.

Enhancing genetic mapping of complex genomes through the design of highly-multiplexed SNP arrays: application to the large and unsequenced genomes of white spruce and black spruce

Affiliations
Comparative Study

Enhancing genetic mapping of complex genomes through the design of highly-multiplexed SNP arrays: application to the large and unsequenced genomes of white spruce and black spruce

Nathalie Pavy et al. BMC Genomics. .

Abstract

Background: To explore the potential value of high-throughput genotyping assays in the analysis of large and complex genomes, we designed two highly multiplexed Illumina bead arrays using the GoldenGate SNP assay for gene mapping in white spruce (Picea glauca [Moench] Voss) and black spruce (Picea mariana [Mill.] B.S.P.).

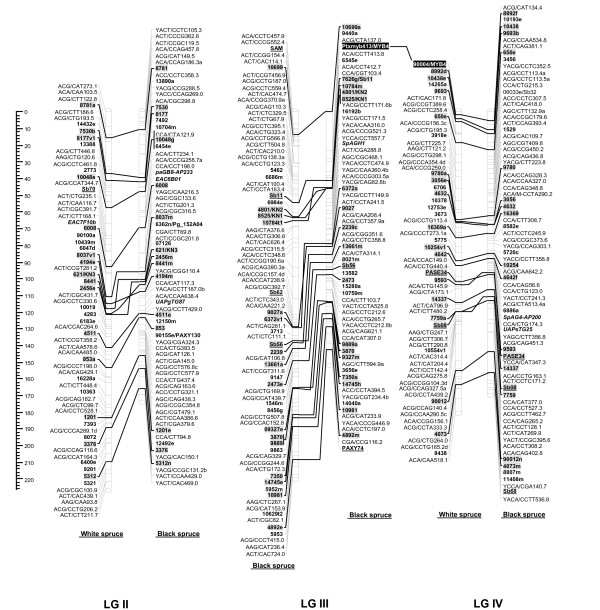
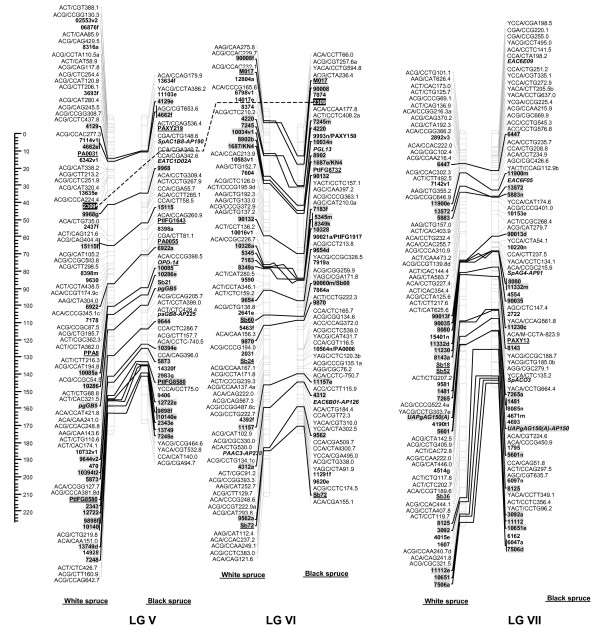
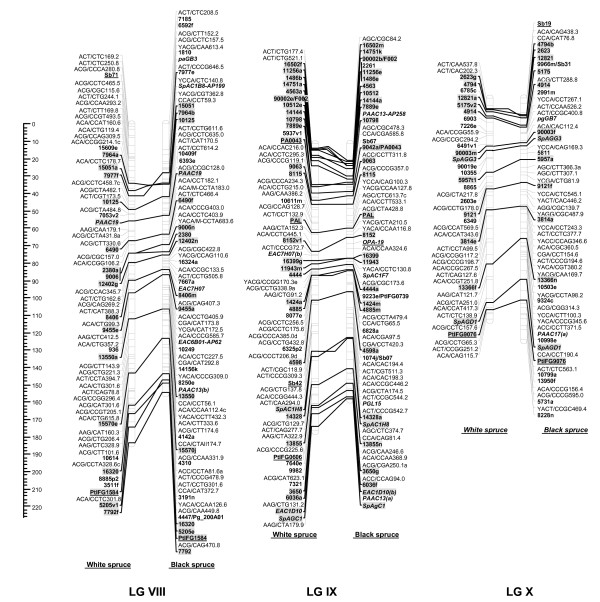
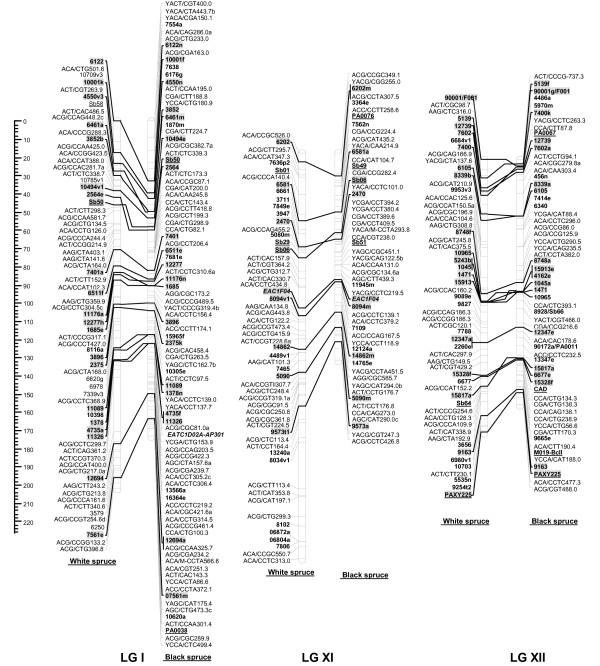
Results: Each array included 768 SNPs, identified by resequencing genomic DNA from parents of each mapping population. For white spruce and black spruce, respectively, 69.2% and 77.1% of genotyped SNPs had valid GoldenGate assay scores and segregated in the mapping populations. For each of these successful SNPs, on average, valid genotyping scores were obtained for over 99% of progeny. SNP data were integrated to pre-existing ALFP, ESTP, and SSR markers to construct two individual linkage maps and a composite map for white spruce and black spruce genomes. The white spruce composite map contained 821 markers including 348 gene loci. Also, 835 markers including 328 gene loci were positioned on the black spruce composite map. In total, 215 anchor markers (mostly gene markers) were shared between the two species. Considering lineage divergence at least 10 Myr ago between the two spruces, interspecific comparison of homoeologous linkage groups revealed remarkable synteny and marker colinearity.

Conclusion: The design of customized highly multiplexed Illumina SNP arrays appears as an efficient procedure to enhance the mapping of expressed genes and make linkage maps more informative and powerful in such species with poorly known genomes. This genotyping approach will open new avenues for co-localizing candidate genes and QTLs, partial genome sequencing, and comparative mapping across conifers.


Figures

Figure 1
Figure 1
Comparison of homoeologous linkage groups (LGs) of composite maps for white spruce (on the left) and black spruce (species complex Picea mariana × P. rubens) (on the right). For each taxon, the composite map was obtained by assembly of two parental datasets and use of JoinMap 3.0 and 4.0. [49,50]. Genetic distances are indicated on the left of the figure (Kosambi). Markers in bold are gene SNPs, markers in bold and underlined are ESTPs, markers in bold and italics are SSRs, markers in italic and underlined are RAPDs and all other markers are AFLPs. Markers with a grey background are common between both taxa. Orthologous and paralogous markers are connected by a solid line and dashed line, respectively. Markers not positioned onto homoeologous LGs are printed in white on a black background.
Figure 2
Figure 2
Comparison of homoeologous linkage groups (LGs) of composite maps for white spruce (on the left) and black spruce (species complex Picea mariana × P. rubens) (on the right). For each taxon, the composite map was obtained by assembly of two parental datasets and use of JoinMap 3.0 and 4.0. [49,50]. Genetic distances are indicated on the left of the figure (Kosambi). Markers in bold are gene SNPs, markers in bold and underlined are ESTPs, markers in bold and italics are SSRs, markers in italic and underlined are RAPDs and all other markers are AFLPs. Markers with a grey background are common between both taxa. Orthologous and paralogous markers are connected by a solid line and dashed line, respectively. Markers not positioned onto homoeologous LGs are printed in white on a black background.
Figure 3
Figure 3
Comparison of homoeologous linkage groups (LGs) of composite maps for white spruce (on the left) and black spruce (species complex Picea mariana × P. rubens) (on the right). For each taxon, the composite map was obtained by assembly of two parental datasets and use of JoinMap 3.0 and 4.0. [49,50]. Genetic distances are indicated on the left of the figure (Kosambi). Markers in bold are gene SNPs, markers in bold and underlined are ESTPs, markers in bold and italics are SSRs, markers in italic and underlined are RAPDs and all other markers are AFLPs. Markers with a grey background are common between both taxa. Orthologous and paralogous markers are connected by a solid line and dashed line, respectively. Markers not positioned onto homoeologous LGs are printed in white on a black background.
Figure 4
Figure 4
Comparison of homoeologous linkage groups (LGs) of composite maps for white spruce (on the left) and black spruce (species complex Picea mariana × P. rubens) (on the right). For each taxon, the composite map was obtained by assembly of two parental datasets and use of JoinMap 3.0 and 4.0. [49,50]. Genetic distances are indicated on the left of the figure (Kosambi). Markers in bold are gene SNPs, markers in bold and underlined are ESTPs, markers in bold and italics are SSRs, markers in italic and underlined are RAPDs and all other markers are AFLPs. Markers with a grey background are common between both taxa. Orthologous and paralogous markers are connected by a solid line and dashed line, respectively. Markers not positioned onto homoeologous LGs are printed in white on a black background.

Similar articles

Cited by

References

    1. Schmid KJ, Sorensen TR, Stracke R, Torjek O, Altmann T, Mitchell-Olds T, Weisshaar B. Large-scale identification and analysis of genome-wide single-nucleotide polymorphisms for mapping in Arabidopsis thaliana. Genome Res. 2003;13:1250–1257. doi: 10.1101/gr.728603. - DOI - PMC - PubMed
    1. Feltus FA, Wan J, Schulze SR, Estill JC, Jiang N, Paterson AH. An SNP resource for rice genetics and breeding based on subspecies indica and japonica. Genome Res. 2004;14:1812–1819. doi: 10.1101/gr.2479404. - DOI - PMC - PubMed
    1. Falque M, Decousset L, Dervins D, Jacob AM, Joets J, Martinant JP, Raffoux X, Ribiere N, Ridel C, Samson D, Charcosset A, Murigneux A. Linkage mapping of 1454 new maize candidate gene loci. Genetics. 2005;170:1957–1966. doi: 10.1534/genetics.104.040204. - DOI - PMC - PubMed
    1. Moran JL, Bolton AD, Tran PV, Brown A, Dwyer ND, Manning DK, Bjork BC, Li C, Montgomery K, Siepka SM, Vitaterna MH, Takahashi JS, Wiltshire T, Kwiatkowski DJ, Kucherlapati R, Beier DR. Utilization of a whole genome SNP panel for efficient genetic mapping in the mouse. Genome Res. 2006;16:436–440. doi: 10.1101/gr.4563306. - DOI - PMC - PubMed
    1. Stein N, Prasad M, Scholz U, Thiel T, Zhang H, Wolf M, Kota R, Varshney RK, Perovic D, Grosse I, Graner A. A 1,000-loci transcript map of the barley genome: new anchoring points for integrative grass genomics. Theor Appl Genet. 2007;114:823–839. doi: 10.1007/s00122-006-0480-2. - DOI - PubMed

Publication types

MeSH terms

LinkOut - more resources