

Maternal and child undernutrition: consequences for adult health and human capital
- PMID: 18206223
- PMCID: PMC2258311
- DOI: 10.1016/S0140-6736(07)61692-4
Maternal and child undernutrition: consequences for adult health and human capital
Erratum in
- Lancet. 2008 Jan 26;371(9609):302
Abstract
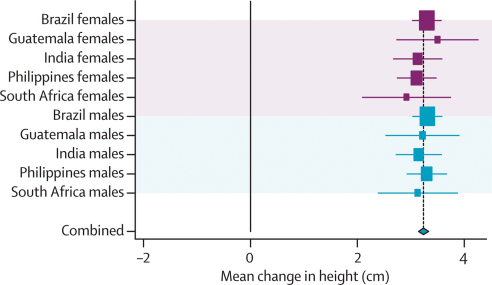
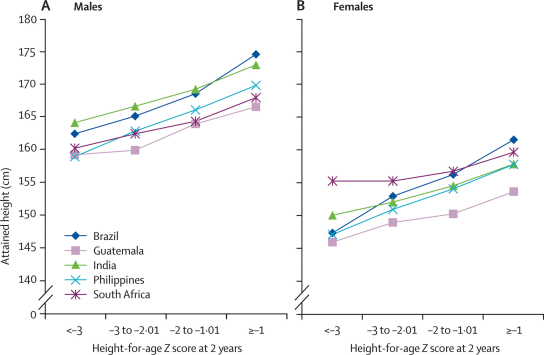
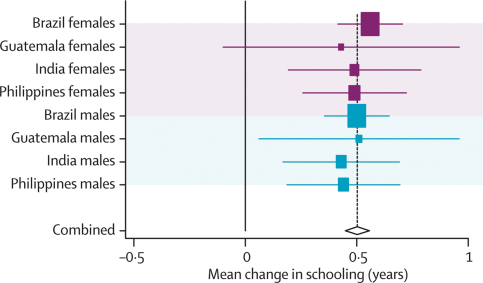
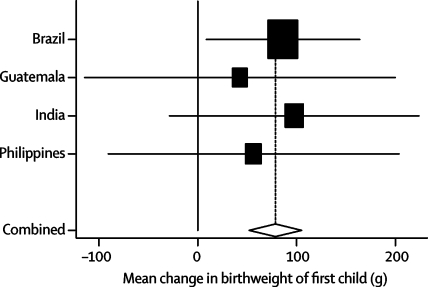
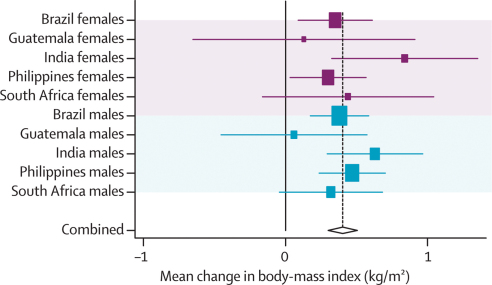
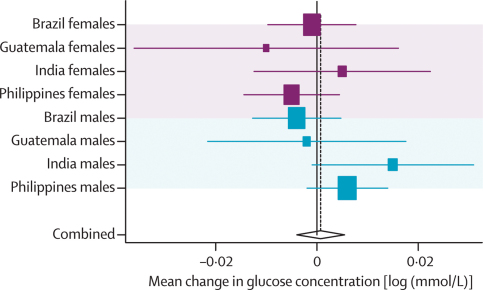
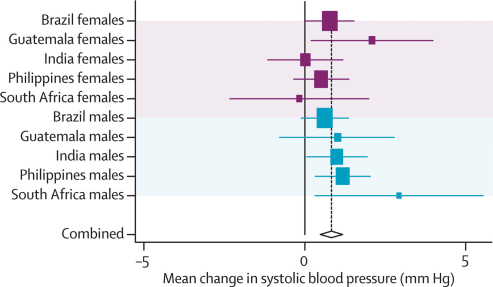
In this paper we review the associations between maternal and child undernutrition with human capital and risk of adult diseases in low-income and middle-income countries. We analysed data from five long-standing prospective cohort studies from Brazil, Guatemala, India, the Philippines, and South Africa and noted that indices of maternal and child undernutrition (maternal height, birthweight, intrauterine growth restriction, and weight, height, and body-mass index at 2 years according to the new WHO growth standards) were related to adult outcomes (height, schooling, income or assets, offspring birthweight, body-mass index, glucose concentrations, blood pressure). We undertook systematic reviews of studies from low-income and middle-income countries for these outcomes and for indicators related to blood lipids, cardiovascular disease, lung and immune function, cancers, osteoporosis, and mental illness. Undernutrition was strongly associated, both in the review of published work and in new analyses, with shorter adult height, less schooling, reduced economic productivity, and--for women--lower offspring birthweight. Associations with adult disease indicators were not so clear-cut. Increased size at birth and in childhood were positively associated with adult body-mass index and to a lesser extent with blood pressure values, but not with blood glucose concentrations. In our new analyses and in published work, lower birthweight and undernutrition in childhood were risk factors for high glucose concentrations, blood pressure, and harmful lipid profiles once adult body-mass index and height were adjusted for, suggesting that rapid postnatal weight gain--especially after infancy--is linked to these conditions. The review of published works indicates that there is insufficient information about long-term changes in immune function, blood lipids, or osteoporosis indicators. Birthweight is positively associated with lung function and with the incidence of some cancers, and undernutrition could be associated with mental illness. We noted that height-for-age at 2 years was the best predictor of human capital and that undernutrition is associated with lower human capital. We conclude that damage suffered in early life leads to permanent impairment, and might also affect future generations. Its prevention will probably bring about important health, educational, and economic benefits. Chronic diseases are especially common in undernourished children who experience rapid weight gain after infancy.
Figures
References
-
- Barker DJ, Osmond C. Infant mortality, childhood nutrition, and ischaemic heart disease in England and Wales. Lancet. 1986;1:1077–1081. - PubMed
-
- Barker DJ, Gluckman PD, Godfrey KM, Harding JE, Owens JA, Robinson JS. Fetal nutrition and cardiovascular disease in adult life. Lancet. 1993;341:938–941. - PubMed
-
- Huxley R, Neil A, Collins R. Unravelling the fetal origins hypothesis: is there really an inverse association between birthweight and subsequent blood pressure? Lancet. 2002;360:659–665. - PubMed
-
- Joseph KS, Kramer MS. Review of the evidence on fetal and early childhood antecedents of adult chronic disease. Epidemiol Rev. 1996;18:158–174. - PubMed
Publication types
MeSH terms
Grants and funding
LinkOut - more resources
Full Text Sources
Medical
