Computerized detection of lung nodules in thin-section CT images by use of selective enhancement filters and an automated rule-based classifier
- PMID: 18206615
- PMCID: PMC2266079
- DOI: 10.1016/j.acra.2007.09.018
Computerized detection of lung nodules in thin-section CT images by use of selective enhancement filters and an automated rule-based classifier
Abstract
Rationale and objectives: We have been developing a computer-aided diagnostic (CAD) scheme for lung nodule detection in order to assist radiologists in the detection of lung cancer in thin-section computed tomography (CT) images.
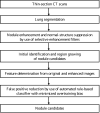
Materials and methods: Our database consisted of 117 thin-section CT scans with 153 nodules, obtained from a lung cancer screening program at a Japanese university (85 scans, 91 nodules) and from clinical work at an American university (32 scans, 62 nodules). The database included nodules of different sizes (4-28 mm, mean 10.2 mm), shapes, and patterns (solid and ground-glass opacity (GGO)). Our CAD scheme consisted of modules for lung segmentation, selective nodule enhancement, initial nodule detection, feature extraction, and classification. The selective nodule enhancement filter was a key technique for significant enhancement of nodules and suppression of normal anatomic structures such as blood vessels, which are the main sources of false positives. Use of an automated rule-based classifier for reduction of false positives was another key technique; it resulted in a minimized overtraining effect and an improved classification performance. We used a case-based four-fold cross-validation testing method for evaluation of the performance levels of our computerized detection scheme.
Results: Our CAD scheme achieved an overall sensitivity of 86% (small: 76%, medium-sized: 94%, large: 95%; solid: 86%, mixed GGO: 89%, pure GGO: 81%) with 6.6 false positives per scan; an overall sensitivity of 81% (small: 69%, medium-sized: 91%, large: 91%; solid: 79%, mixed GGO: 88%, pure GGO: 81%) with 3.3 false positives per scan; and an overall sensitivity of 75% (small: 60%, medium-sized: 88%, large: 87%; solid: 70%, mixed GGO: 87%, pure GGO: 81%) with 1.6 false positives per scan.
Conclusion: The experimental results indicate that our CAD scheme with its two key techniques can achieve a relatively high performance for nodules presenting large variations in size, shape, and pattern.
Figures


References
-
- Greenlee RT, Murray T, Bolden S, Wingo PA. Cancer statistics, 2000. CA Cancer Journal of Clinicians. 2000;50:7–33. - PubMed
-
- Sone S, Takashima S, Li F, Yang Z, Honda T, Maruyama Y, Hasegawa M, Yamanda T, Kubo K, Hanamura K, Asakura K. Mass screening for lung cancer with mobile spiral computed tomography scanner. Lancet. 1998;351:242–245. - PubMed
-
- Henschke CI, McCauley DI, Yankelevitz DF, Naidich DP, McGuinness G, Miettinen OS, Libby DM, Pasmantier MW, Koizumi J, Altorki NK, Smith JP. Early lung cancer action project: overall design and findings from baseline screening. Lancet. 1999;354:99–105. - PubMed
-
- Doi K. Overview on research and development of computer-aided diagnostic schemes. Seminars in Ultrasound, CT, and MRI. 2004;25:404–410. - PubMed
-
- Li Q, Li F, Suzuki K, Shiraishi J, Abe H, Engelmann R, Nie YK, MacMahon H, Doi K. Computer-aided diagnosis in thoracic CT. Seminars in US, CT, and MRI. 2005;26:357–363. - PubMed
Publication types
MeSH terms
Grants and funding
LinkOut - more resources
Full Text Sources
Medical
Miscellaneous

