. 2008 Feb;36(2):158-71.
doi: 10.1016/j.exphem.2007.10.001.

Altered SDF-1/CXCR4 axis in patients with primary myelofibrosis and in the Gata1 low mouse model of the disease

Affiliations

Altered SDF-1/CXCR4 axis in patients with primary myelofibrosis and in the Gata1 low mouse model of the disease

Anna Rita Migliaccio et al. Exp Hematol. 2008 Feb.

Abstract

Objective: To assess whether alterations in the stromal cell-derived factor-1 (SDF-1)/CXCR4 occur in patients with primary myelofibrosis (PMF) and in Gata1 low mice, an animal model for myelofibrosis, and whether these abnormalities might account for increased stem/progenitor cell trafficking.

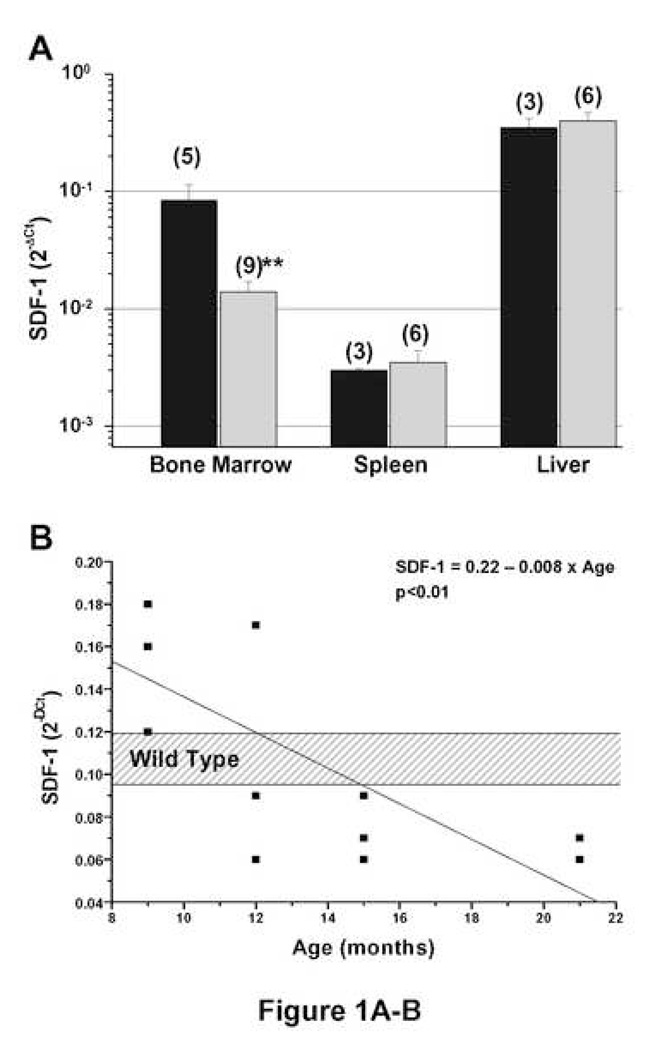
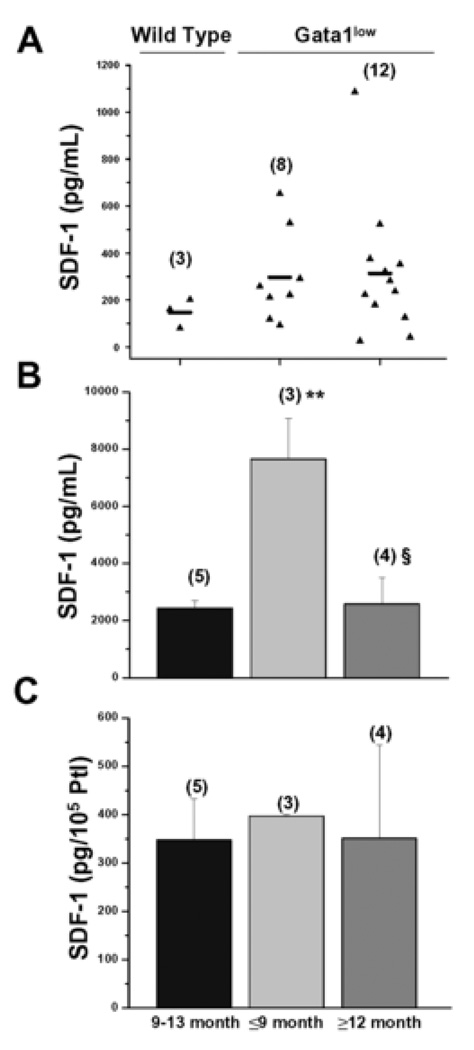
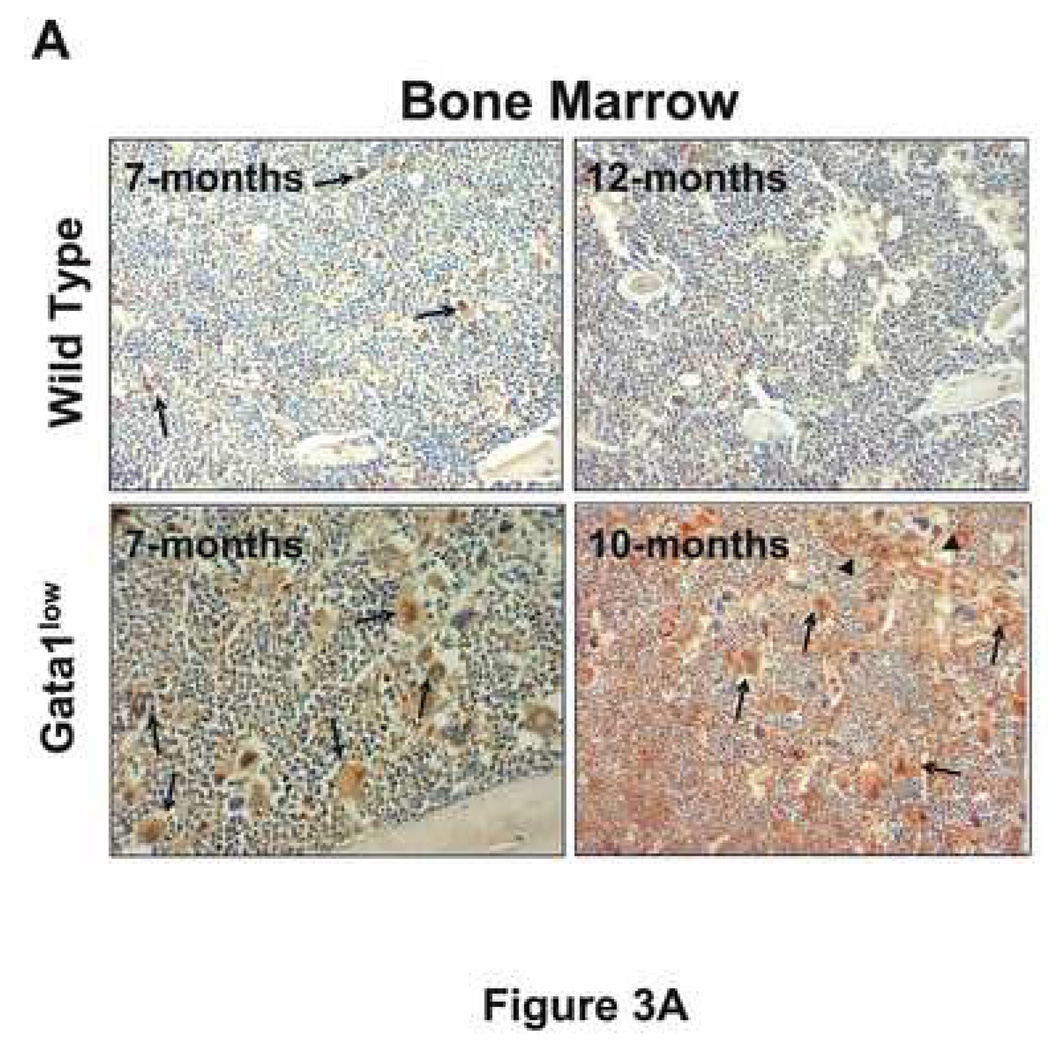
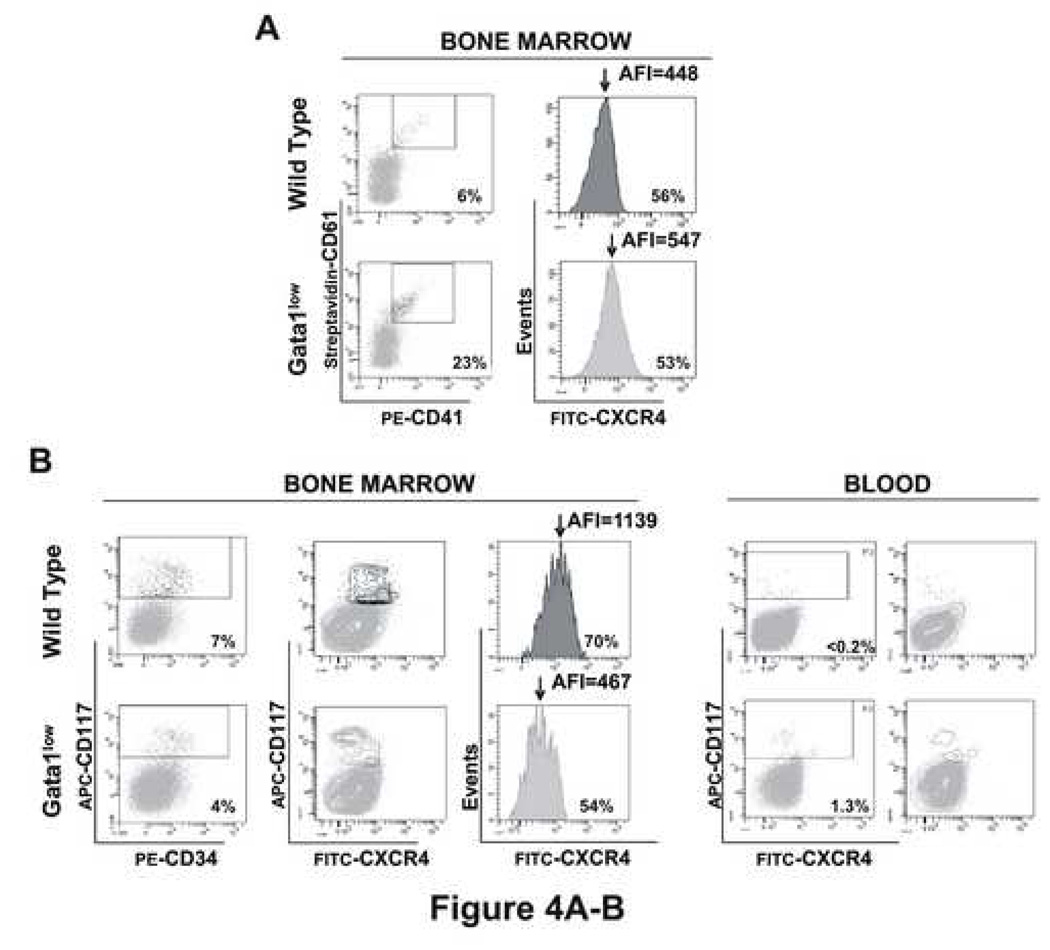
Materials and methods: In the mouse, SDF-1 mRNA levels were assayed in liver, spleen, and marrow. SDF-1 protein levels were quantified in plasma and marrow and CXCR4 mRNA and protein levels were evaluated on stem/progenitor cells and megakaryocytes purified from the marrow. SDF-1 protein levels were also evaluated in plasma and in marrow biopsy specimens obtained from normal donors and PMF patients.

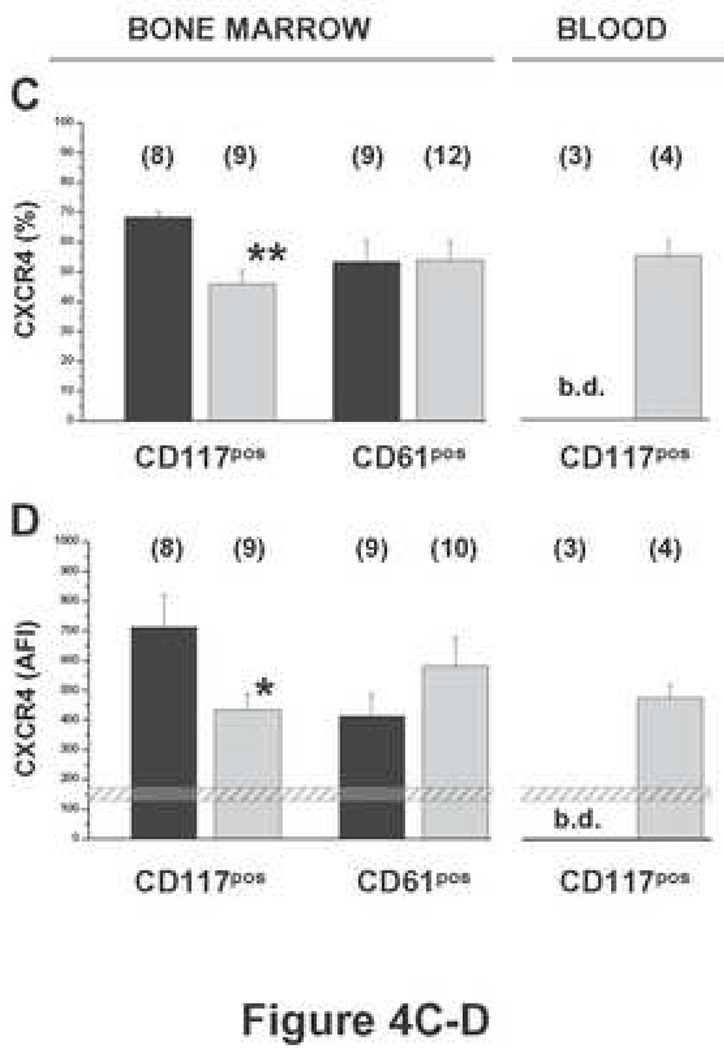
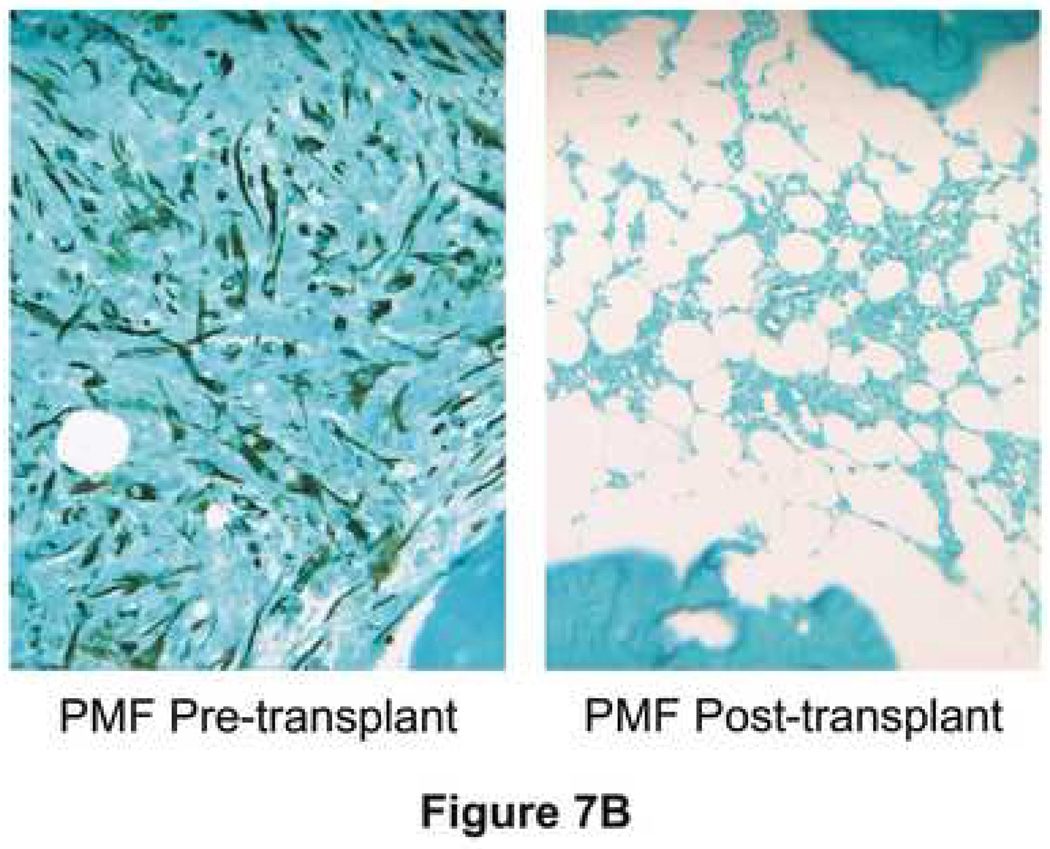
Results: In Gata1 low mice, the plasma SDF-1 protein was five times higher than normal in younger animals. Furthermore, SDF-1 immunostaining of marrow sections progressively increased with age. Similar abnormalities were observed in PMF patients. In fact, plasma SDF-1 levels in PMF patients were significantly higher (by twofold) than normal (p < 0.01) and SDF-1 immunostaining of marrow biopsy specimens demonstrated increased SDF-1 deposition in specific areas. In two of the patients, SDF-1 deposition was normalized by curative therapy with allogenic stem cell transplantation. Similar to what already has been reported for PMF patients, the marrow from Gata1 low mice contained fewer CXCR4 pos CD117 pos cells and these cells expressed low levels of CXCR4 mRNA and protein.

Conclusion: Similar abnormalities in the SDF-1/CXCR4 axis are observed in PMF patients and in the Gata1 low mice model of myelofibrosis. We suggest that these abnormalities contribute to the increased stem/progenitor cell trafficking observed in this mouse model as well as patients with PMF.


Figures

Figure 1
Figure 1. Reduced expression of SDF-1 mRNA in the bone marrow of Gata1low mice
A. Levels of SDF-1 mRNA in cells from the marrow, the spleen and the liver of wild type (grey bars) and Gata1low (light grey bars) littermates, as indicated. Results are expressed in 2−ΔCt, and are presented as mean (±SD) of independent determinations, each one with a different mouse, the number of which is indicated in parenthesis on the top of each column. Results obtained with animals at different ages were pooled Values statistically different (p<0.01) from controls are indicated by **. B. The levels of SDF-1 mRNA in the entire femur of Gata1low mice with disease progression. Each determination was performed in duplicate and results are expressed in 2−ΔCt. The age of Gata1low mice analyzed is indicated on the X axis, and each dot represents an individual mouse. The levels of SDF-1 mRNA in the entire femur of the wild type littermates did not change with age and are indicated by the shaded area [mean(±SD) of 5 independent determinations].
Figure 2
Figure 2. The plasma from younger (≤9 month-old) Gata1low mice contains significantly higher SDF-1 levels than those present in the plasma of wild type littermates
A. SDF-1 levels in marrow washes of Gata1low mice and of wild type littermates. Mutant mice were divided into two age groups (younger, ≤9 month-old, and older, ≥12 month-old) while control mice were 9–13-month-old. The number of animals analyzed in each group is indicated in parenthesis. Each triangle represents the mean of replicate determinations on the plasma of an individual mouse. (−) indicates the mean for each experimental group. The SDF-1 levels observed in the three age groups were not statistically different. B. SDF-1 levels in the plasma of Gata1low mice and of wild type littermates. The mice were divided in the same experimental groups described in A. Each determination was performed in duplicate and results are presented as mean (±SD) of independent determinations. The number of mice analyzed per experimental group is indicated in parenthesis. ** and § indicate values statistically different (p<0.01) from wild type and younger mutant mice, respectively. C. SDF-1 levels in platelets purified from the blood of Gata1low mice and of wild type littermates. Each determination was performed in duplicate and results are presented as mean (±SD) of independent determinations. The number of mice analyzed per experimental group is indicated in parenthesis.
Figure 3
Figure 3. Increased SDF-1-immunostaining of marrow and spleen sections from Gata1low mice with age
SDF-1-immunostaining of representative sections from marrow (A), spleen (B) and liver (C) of younger (7-month) and older (10–12-month) wild type (top panels) and Gata1low (bottom panels) littermates are presented as indicated. Slides were counterstained with hematoxylin-eosin. Similar results were obtained with sections from at least 4 additional mice per experimental point, for a total of 14 animals. Arrows and arrowheads indicate representative megakaryocytes and stromal fibers, respectively. Magnification 40X.
Figure 4
Figure 4. Marrow megakaryocytes (CD41pos/CD61pos) from Gata1low mice express normal levels of CXCR4 while marrow stem/progenitor cells (CD117pos) from the same mice express reduced levels of CXCR4. On the other hand, CD117pos cells from the marrow and blood of Gata1low mice have a similar CXCR4 flow cytometric profile
Flow cytometric determinations of cells expressing CXCR4 among the CD41pos/CD61pos (megakaryocytes) and CD117pos (stem/progenitor cells) cells of the marrow and of marrow and blood of representative wild type and Gata1low mice are presented in A and B, respectively. In the case of the marrow, CXCR4 expression is presented both as a contour plot and as histogram in order to highlight the population profiles and the mean fluorescence intensity, respectively. The numbers within the quadrants indicate the frequency of the different cell populations while those near the arrows indicate the average fluorescence intensity (AFI) per cell. Isotype controls for CXCR4 analyses are presented in grey while isotype controls for CD41/CD61 and CD34/CD117 analyses are not shown. The mean (±SD) of independent determinations of the frequency and levels (AFI) of CXCR4 expressed by the cells are presented in C and D, respectively. In these graphs, results obtained with wild type and Gata1low mice are indicated in dark and light grey, respectively. The number of mice analyzed per experimental point is indicated in parenthesis while values statistically different (p<0.05 or 0.01) from wild type controls are indicates with * and **. b.d. = below detection.
Figure 5
Figure 5. In the marrow from Gata1low mice, megakaryocytes (CD61pos) express normal levels of CXCR4 mRNA while the CXCR4pos fraction of the stem/progenitor cells (CD117pos/CD34neg and CD34pos) express levels of CXCR4 mRNA lower than normal
Representative gates used to purify the different populations and re-analyses of the sorted cells for purity are presented on the left. Wild type CD117pos cells sorted on the basis of high CXCR4 expression retained their antigenic profile upon re-analysis. In contrast, >60% of the cells sorted as CXCR4pos from Gata1low mice resulted CXCR4neg upon re-analysis. Mean (±SD) CXCR4 mRNA levels, expressed as 2−ΔCt, of independent determinations, each one in duplicate, are presented on the right. Results obtained with wild type and Gata1low littermates are indicated by grey and light grey bars, respectively. The number of mice analyzed per experimental point is indicated in parenthesis. Values statistically different (p< 0.01) from those expressed by wild type CD117pos cells are indicated with § while those different from wild type CD117pos/CXCR4pos cells are indicated with **.
Figure 6
Figure 6. The plasma from PMF and PV patients contains SDF-1 levels significantly higher that those present in the plasma of normal donors
Each symbol represents the value observed in a different subject and (−) indicates the mean SDF-1 content in each experimental group. The N values indicate the number of subjects analyzed per group.
Figure 7
Figure 7. A. SDF-1 immunohistochemistry of bone marrow sections from two normal controls and 2 PMF patients
Sections were stained with a monoclonal anti-human SDF-1 antibody and then were counterstained with Light Green. Results are representative of those obtained from 2 different normal controls, and 2 different PMF patients (Magnification 200X). Figure 7BSDF-1 immunohistochemistry of marrow sections from a PMF patient before and after allogenic bone marrow transplantation. Bone marrow biopsy sections were stained with a monoclonal anti-human SDF-1 antibody and then were counterstained with Light Green (Magnification X200).

References

    1. Hoffman R, Xu M, Barosi G. Myelofibrosis with myeloid metaplasia. In: Hoffman R, Benz E Jr, Shattil S, Furie B, Cohen HJ, Silberstein L, McGlave P, editors. Hematology: Basic Principles and Practice. 5th Edition. New York: Churchill Livingstone; 2008. In Press.
    1. Tefferi A. Myelofibrosis with myeloid metaplasia. N Engl J Med. 2000;342:1255–1265. - PubMed
    1. Barosi G. Myelofibrosis with myeloid metaplasia: diagnostic definition and prognostic classification for clinical studies and treatment guidelines. J Clin Oncol. 1999;17:2954–2970. - PubMed
    1. Guyot B, Murai K, Fujiara Y, et al. Characterization of a megakaryocyte-specific enhancer of the key hemopoietic transcription factor GATA-1. J Biol Chem. 2006;281:13733–13742. - PubMed
    1. McDevitt MA, Shivdasani RA, Fujiwara Y, Yang H, Orkin SH. A "knockdown" mutation created by cis-element gene targeting reveals the dependence of erythroid cell maturation on the level of transcription factor GATA-1. Proc Natl Acad Sci U S A. 1997;94:6781–6785. - PMC - PubMed

Publication types

MeSH terms