

Blood-brain barrier disruption induced by focused ultrasound and circulating preformed microbubbles appears to be characterized by the mechanical index
- PMID: 18207311
- PMCID: PMC2442477
- DOI: 10.1016/j.ultrasmedbio.2007.10.016
Blood-brain barrier disruption induced by focused ultrasound and circulating preformed microbubbles appears to be characterized by the mechanical index
Abstract
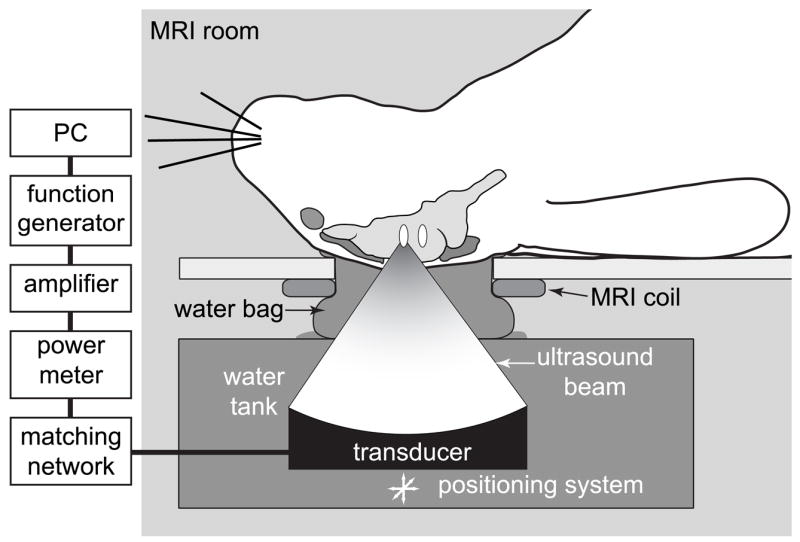
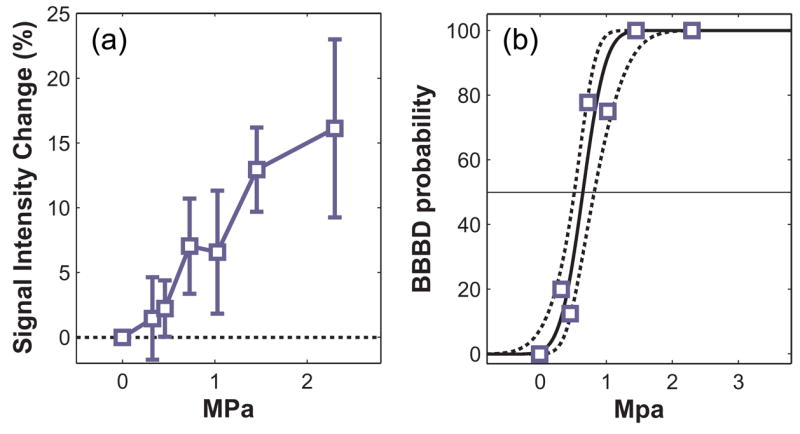
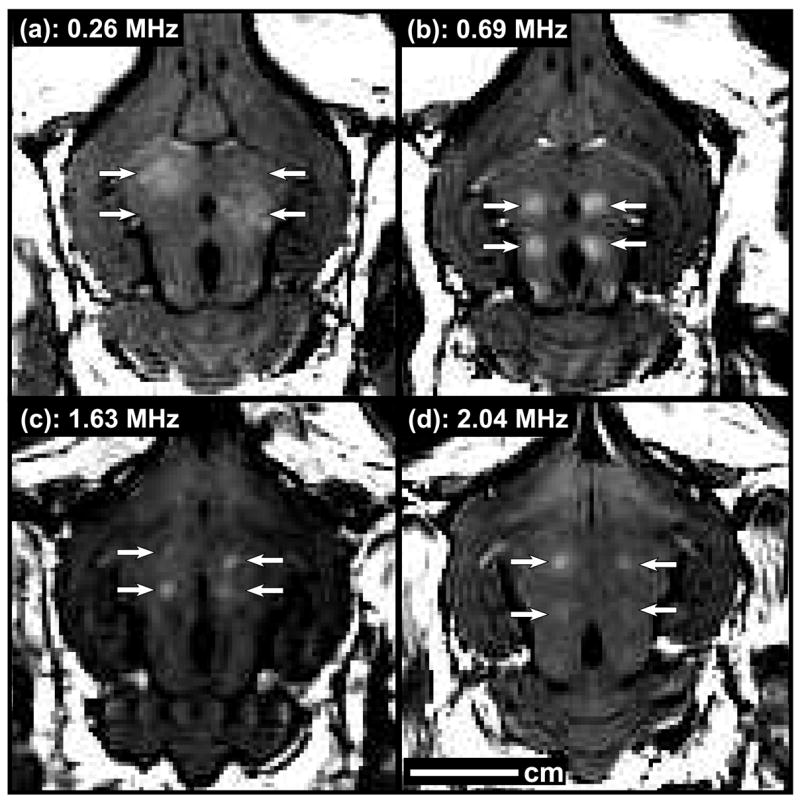
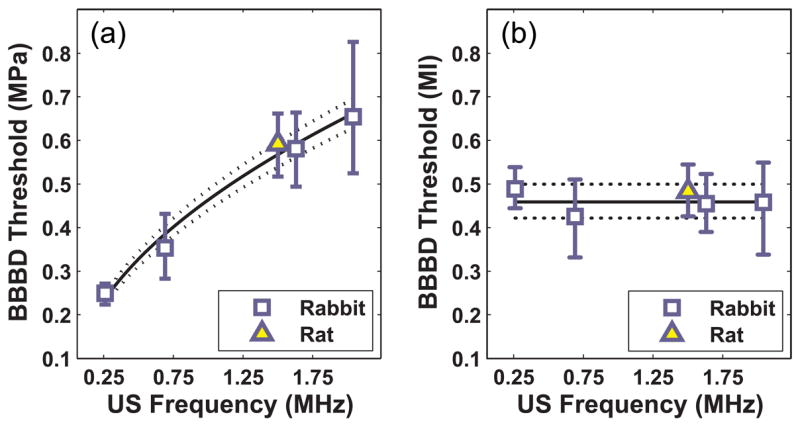
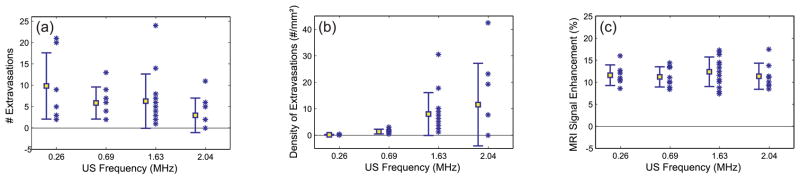
This work investigated the effect of ultrasonic frequency on the threshold for blood-brain barrier (BBB) disruption induced by ultrasound pulses combined with an ultrasound contrast agent. Experiments were performed in rabbits using pulsed sonications at 2.04 MHz with peak pressure amplitudes ranging from 0.3 to 2.3 MPa. BBB disruption was evaluated using contrast-enhanced magnetic resonance imaging. The threshold for BBB disruption was estimated using probit regression. Representative samples with similar amounts of contrast enhancement were examined in light microscopy. Results from these experiments were compared with data from previous studies that used ultrasound frequencies between 0.26 and 1.63 MHz. We found that the BBB disruption threshold (value where the probability for disruption was estimated to be 50%) expressed in terms of the peak negative pressure amplitude increased as a function of the frequency. It appeared to be constant, however, when the exposures were expressed as a function of the mechanical index (peak negative pressure amplitude estimated in situ divided by square root of frequency). Regression of data from all frequencies resulted in an estimated mechanical index threshold of 0.46 (95% confidence intervals: 0.42 to 0.50). Histologic examination of representative samples with similar amounts of blood-brain barrier disruption found that the number of regions containing extravasated red blood cells per unit area was substantially lower on average for lower ultrasound frequencies. This data suggests that the mechanical index is a meaningful metric for ultrasound-induced blood-brain barrier disruption, at least for when other parameters that are not taken into account by the mechanical index are not varied. It also suggests that lower frequency sonication produces less red blood cell extravasation per unit area.
Figures

References
-
- Apfel RE, Holland CK. Gauging the likelihood of cavitation from short-pulse, low-duty cycle diagnostic ultrasound. Ultrasound Med Biol. 1991;17:179–185. - PubMed
-
- Child SZ, Hartman CL, Schery LA, Carstensen EL. Lung damage from exposure to pulsed ultrasound. Ultrasound Med Biol. 1990;16:817–825. - PubMed
-
- Choi JJ, Pernot M, Small SA, Konofagou EE. Noninvasive, transcranial and localized opening of the blood-brain barrier using focused ultrasound in mice. Ultrasound Med Biol. 2007;33:95–104. - PubMed
-
- Finney DJ. Probit Analysis. Cambridge, U.K.: Cambridge University Press; 1971.
Publication types
MeSH terms
Substances
Grants and funding
LinkOut - more resources
Full Text Sources
Other Literature Sources
Medical
