. 2008 Apr;238(1-2):12-24.
doi: 10.1016/j.heares.2007.11.012. Epub 2007 Dec 8.

Functional localization of auditory cortical fields of human: click-train stimulation

Affiliations

Functional localization of auditory cortical fields of human: click-train stimulation

John F Brugge et al. Hear Res. 2008 Apr.

Abstract

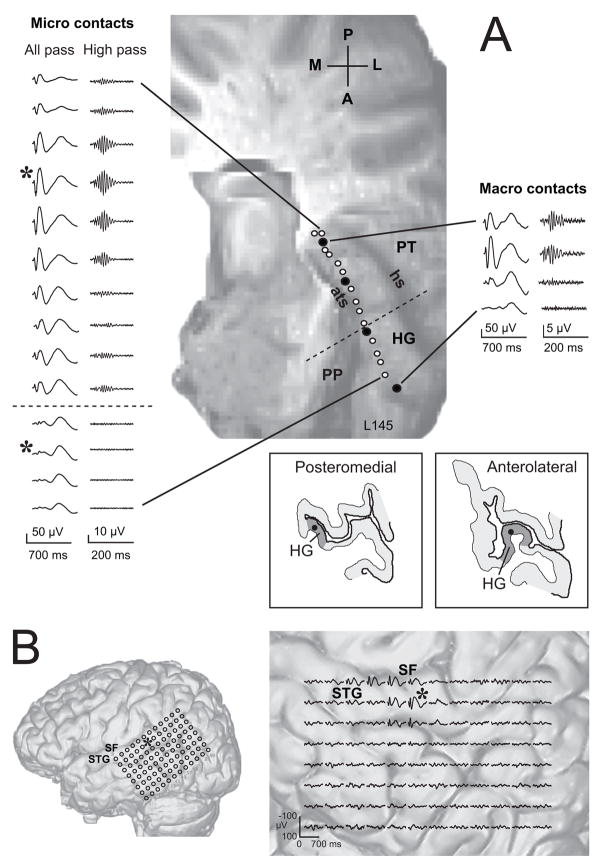
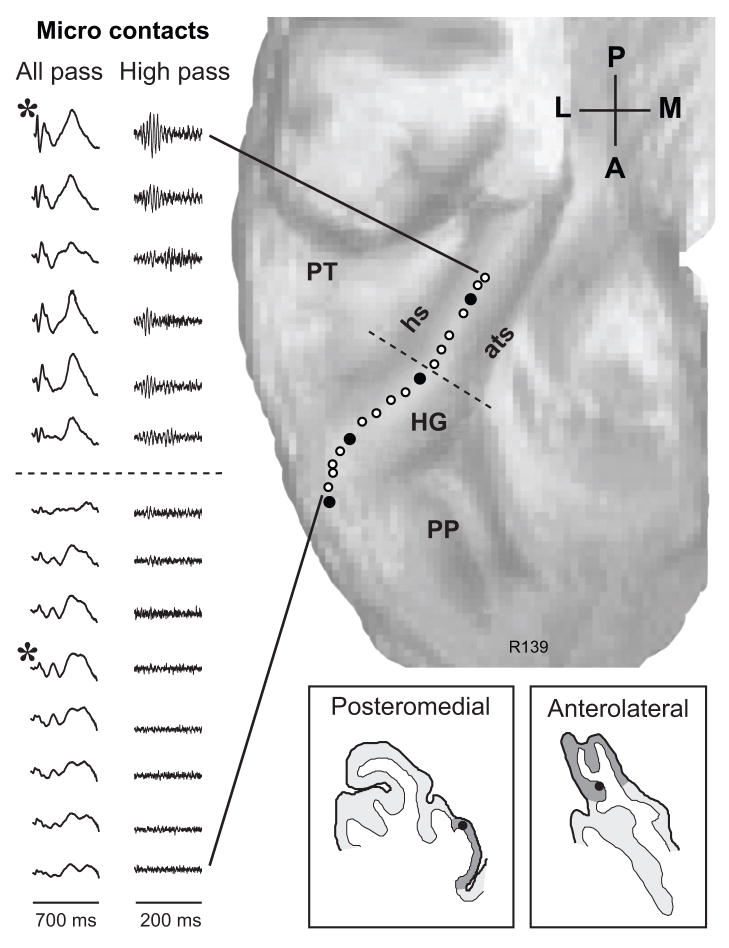
Averaged auditory evoked potentials (AEPs) to bilaterally presented 100 Hz click trains were recorded from multiple sites simultaneously within Heschl's gyrus (HG) and on the posterolateral surface of the superior temporal gyrus (STG) in epilepsy-surgery patients. Three auditory fields were identified based on AEP waveforms and their distribution. Primary (core) auditory cortex was localized to posteromedial HG. Here the AEP was characterized by a robust polyphasic low-frequency field potential having a short onset latency and on which was superimposed a smaller frequency-following response to the click train. Core AEPs exhibited the lowest response threshold and highest response amplitude at one HG site with threshold rising and amplitude declining systematically on either side of it. The AEPs recorded anterolateral to the core, if present, were typically of low amplitude, with little or no evidence of short-latency waves or the frequency-following response that characterized core AEPs. We suggest that this area is part of a lateral auditory belt system. Robust AEPs, with waveforms demonstrably different from those of the core or lateral belt, were localized to the posterolateral surface of the STG and conform to previously described field PLST.


Figures

Figure 1
Figure 1
A. AEPs recorded from 14 micro-contact and 4 macro-contact sites along the length of HG of the left hemisphere of one subject. In this and subsequent figures negative voltage is plotted upward. AEPs in left column were filtered from 1.6 to 1000 Hz, those in right column from 70 to 1000 Hz. Asterisk marks two sites of maximal amplitude of response, in posteromedial and anterolateral HG. Dashed line denotes where a functional transition takes place in the sequence of AEPs. Drawings of MRI cross sections show the position of the recording electrode (closed black circle) within the grey matter (light grey shading) at the two representative recording locations marked with the asterisk. Dark grey shading denotes the estimated medio-lateral extent of HG. The electrode trajectory and location of each recording site are shown on the surface rendering of the superior temporal plane. Open circles: micro contacts; closed circles: macro contacts; HG: Heschl’s gyrus; ats: anterior transverse sulcus; hs: Heschl’s sulcus; PT: planum temporale, PP: planum polare. B. All-pass AEPs recorded from the 96-contact grid on the peri-sylvian cortex. The locations of the recording contacts are shown on the MRI rendering of the lateral surface of the cerebral hemisphere. Expanded view shows the AEPs recorded at each site. SF: Sylvian fissure; STG: superior temporal gyrus.
Figure 2
Figure 2
AEP waveforms obtained at the sites of maximal amplitude on posteromedial (A–D) and anterolateral (E–G) HG and from posterolateral STG (I–L) plotted at different time scales. Filters: 1.6 to 1000 Hz for all but D,H,L, for which a high-pass filter (70–1000 Hz) was employed. Latency (ms) of major deflections shown on figures.
Figure 3
Figure 3
AEPs recorded from 14 micro-contact and 4 macro-contact sites along the length of HG of the right hemisphere. See legend of Fig. 1 for details.
Figure 4
Figure 4
AEPs obtained at the site of maximal amplitude of response in posteromedial HG of 12 subjects. Left-hand column AEP filter 1.6–1000 Hz, right-hand column 70–1000 Hz. Amplitudes adjusted for comparison of waveforms.
Figure 5
Figure 5
Effects of changing stimulus level on AEP obtained at the site of maximal amplitude of response on posteromedial HG denoted by a circle on the surface rendering of the supratemporal plane. Drawing of MRI cross section shows electrode within the grey matter near the crown of the gyrus. See legend of Fig. 1 for details.
Figure 6
Figure 6
Effects of changing stimulus level on the AEP map of the left and right HG of two subjects. High-pass filtered AEP omitted for clarity of presentation. See legends of Fig. 1 and 5 for details.

References

    1. Arezzo J, Pickoff A, Vaughan HG., Jr The sources and intracerebral distribution of auditory evoked potentials in the alert rhesus monkey. Brain Res. 1975;90:57–73. - PubMed
    1. Bailey P, Bonin G. The Isocortex of Man. University of Illinois Press; Urbana: 1951.
    1. Bidet-Caulet A, Fischer C, Besle J, Aguera PE, Giard MH, Bertrand O. Effects of selective attention on the electrophysiological representation of concurrent sounds in the human auditory cortex. J Neurosci. 2007;27:9252–9261. - PMC - PubMed
    1. Binder JR, Frost JA, Hammeke TA, Bellgowan PS, Springer JA, Kaufman JN, Possing ET. Human temporal lobe activation by speech and nonspeech sounds. Cereb Cortex. 2000;10:512–528. - PubMed
    1. Brodmann K. Vergleichende Loakalisationslehre der Grosshirnrinde. J.A. Barth; Leipzig: 1909.

Publication types