. 2008 Jan;4(1):e4.
doi: 10.1371/journal.pgen.0040004.

Analysis and application of European genetic substructure using 300 K SNP information

Affiliations

Analysis and application of European genetic substructure using 300 K SNP information

Chao Tian et al. PLoS Genet. 2008 Jan.

Abstract

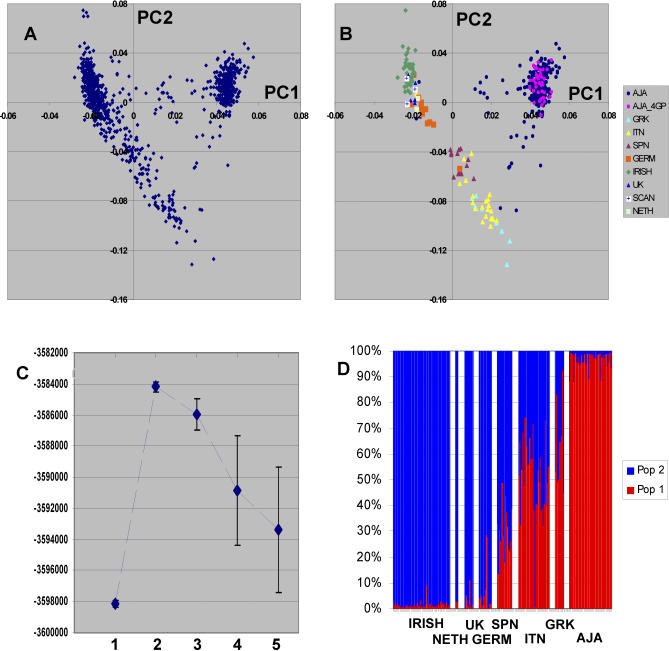
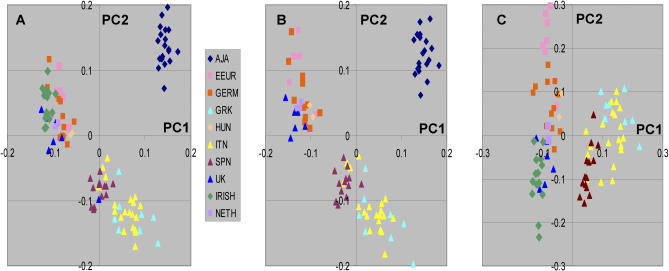
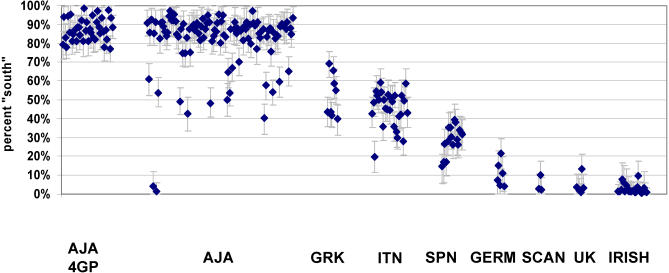
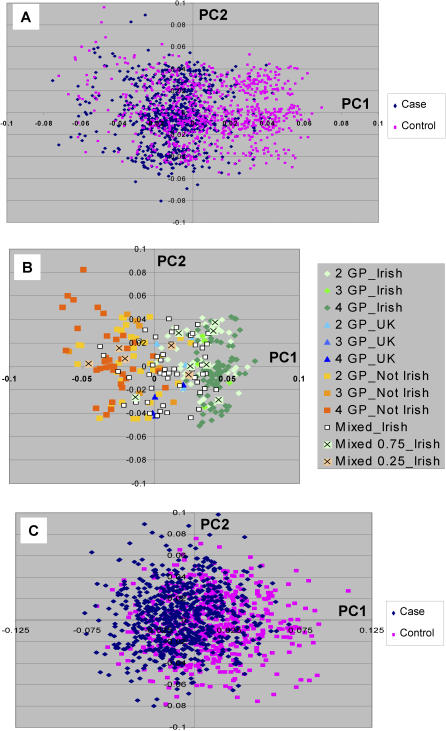
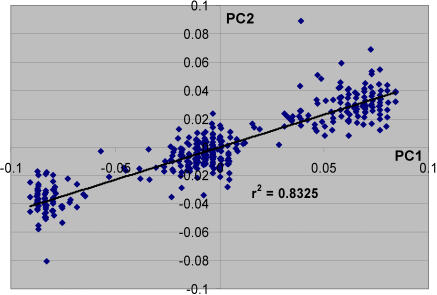
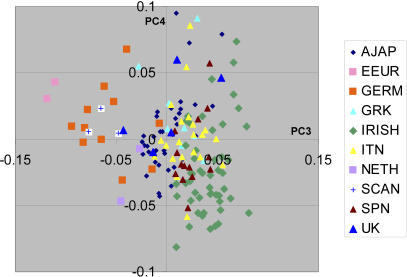
European population genetic substructure was examined in a diverse set of >1,000 individuals of European descent, each genotyped with >300 K SNPs. Both STRUCTURE and principal component analyses (PCA) showed the largest division/principal component (PC) differentiated northern from southern European ancestry. A second PC further separated Italian, Spanish, and Greek individuals from those of Ashkenazi Jewish ancestry as well as distinguishing among northern European populations. In separate analyses of northern European participants other substructure relationships were discerned showing a west to east gradient. Application of this substructure information was critical in examining a real dataset in whole genome association (WGA) analyses for rheumatoid arthritis in European Americans to reduce false positive signals. In addition, two sets of European substructure ancestry informative markers (ESAIMs) were identified that provide substantial substructure information. The results provide further insight into European population genetic substructure and show that this information can be used for improving error rates in association testing of candidate genes and in replication studies of WGA scans.


Conflict of interest statement

Competing interests. The authors have declared that no competing interests exist.

Figures

Figure 1
Figure 1. European Substructure Analysis of a Diverse Set of Individuals of European Descent
(A) Graphic representation of the first two PCs for 952 individuals genotyped with 300K SNPs. (B) Color code shows subgroup of individuals with more detailed grandparental origin information. Each color-coded individual had 4GP of origin information with the exception of the AJA group. The individuals included 14 Spanish (SPN), 28 Italian (ITN), eight Greek (GRK), 11 German (GERM), 52 IRISH, five United Kingdom (UK), three Scandinavian (SCAN), and two Netherland (NETH). For the Ashkenazi Jewish individuals, 38 had 4GP information (AJA_4GP), and 220 participants were self identified as Ashkenazi Jewish (AJA) but without other information. (C) The STRUCTURE analyses shows results from the same participant set using three random sets of >3,500 SNPs for assessment of the number of population groups (K). The ordinate shows the Ln probability (mean +/− SD) corresponding to the number of clusters. (D) STRUCTURE results under the assumption of two population groups (K = 2). The proportion of each cluster group (population) for each individual is shown by the color code.
Figure 2
Figure 2. Comparison of Principal Component Analysis Excluding Different Individual Groups
Color key shows groups as defined in Figure 1. (A) All individuals with 4GP information. (B) Same individual set except exclusion of individuals of Irish descent. (C) Same individual set with exclusion of Ashkenazi Jewish individuals.
Figure 3
Figure 3. STRUCTURE Analysis Using 1,400 ESAIMs Selected for North/South Information
Analysis was performed without any prior population assignment using STRUCTURE under the assumption of two population groups (K = 2). The results are shown for only individuals not used in selection of the north/south-ESIAMs. The individual individuals and 90% confidence limits are shown for selected groups with ethnic and grandparental origins (see Figure S1 for entire results). The individuals grouped by self identification included: Ashkenazi 4GP; Ashkenazi Jewish (without 4GP information) (AJA); Greek (GRK); Italian (ITN); Spanish (SPN); German (GERM); Scandinavian (SCAN); United Kingdom (UK); and Irish.
Figure 4
Figure 4. Analysis of European Substructure in Northern European Individuals
(A) The first two PCs are depicted for RA cases and NYCP controls. (B) Color codes show the Irish contribution to each individual with at least two GP country of origin information in the sample set shown in (A), e.g., the 2GP Irish individuals have 2GP Irish origin and 2GP unknown or USA origin; Not Irish includes only individuals without known Irish ancestry and with at least 2GP information; mixed Irish are those individuals with at least one GP Irish and one GP non-Irish. (C) Analysis using 1,211 ESAIMs selected for differences along PC1 in northern European individuals (see Results).
Figure 5
Figure 5. Principal Component Analysis Shows Chromosome 8 Inversion
The selected informative SNPs from a 3.8 Mb segment of Chromosome 8 shows the same PC score distribution as the entire SNP set for the second PC in analysis of “northern” European individuals. The graph shows the position of each of 382 tested individuals for the second axis in the PCA using 500K SNPs (ordinate) and the position based on analysis using 20 selected SNPs from the 3.8 Mb segment of Chromosome 8 (abscissa). The 20 selected SNPs were those with the highest In between the outer groups in an independent dataset separated by a minimum of 50 kb.
Figure 6
Figure 6. Graphic Display of Principal Components 3 and 4 after Deletion of Chromosome 8 Inversion
Results of individuals with 4GP information are shown.

Comment in

References

    1. Marchini J, Cardon LR, Phillips MS, Donnelly P. The effects of human population structure on large genetic association studies. Nat Genet. 2004;36:512–517. - PubMed
    1. Freedman ML, Reich D, Penney KL, McDonald GJ, Mignault AA, et al. Assessing the impact of population stratification on genetic association studies. Nat Genet. 2004;36:388–393. - PubMed
    1. Campbell CD, Ogburn EL, Lunetta KL, Lyon HN, Freedman ML, et al. Demonstrating stratification in a European American population. Nat Genet. 2005;37:868–872. - PubMed
    1. Clayton DG, Walker NM, Smyth DJ, Pask R, Cooper JD, et al. Population structure, differential bias and genomic control in a large-scale, case-control association study. Nat Genet. 2005;37:1243–1246. - PubMed
    1. Helgason A, Yngvadottir B, Hrafnkelsson B, Gulcher J, Stefansson K. An Icelandic example of the impact of population structure on association studies. Nat Genet. 2005;37:90–95. - PubMed

Publication types