Comparative Study
. 2008 Jan;4(1):e9.
doi: 10.1371/journal.pgen.0040009. Epub 2007 Dec 13.

Large-scale population study of human cell lines indicates that dosage compensation is virtually complete

Affiliations
Comparative Study

Large-scale population study of human cell lines indicates that dosage compensation is virtually complete

Colette M Johnston et al. PLoS Genet. 2008 Jan.

Abstract

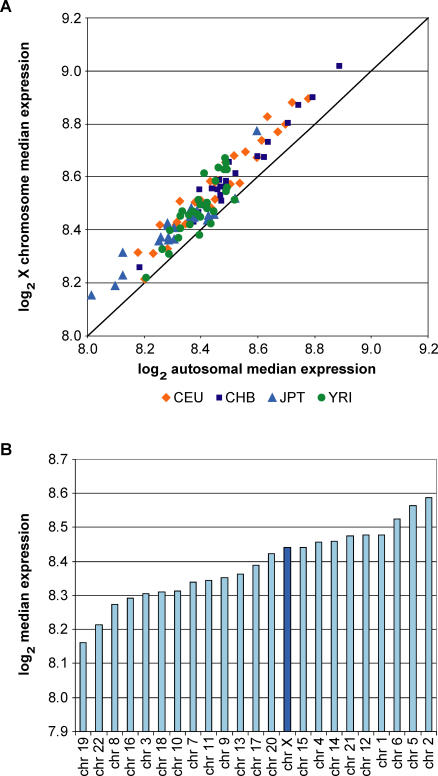
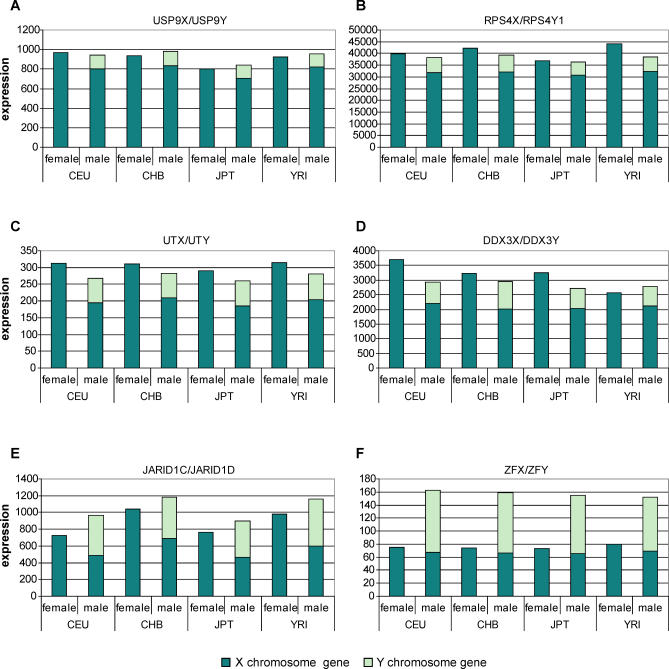
X chromosome inactivation in female mammals results in dosage compensation of X-linked gene products between the sexes. In humans there is evidence that a substantial proportion of genes escape from silencing. We have carried out a large-scale analysis of gene expression in lymphoblastoid cell lines from four human populations to determine the extent to which escape from X chromosome inactivation disrupts dosage compensation. We conclude that dosage compensation is virtually complete. Overall expression from the X chromosome is only slightly higher in females and can largely be accounted for by elevated female expression of approximately 5% of X-linked genes. We suggest that the potential contribution of escape from X chromosome inactivation to phenotypic differences between the sexes is more limited than previously believed.


Conflict of interest statement

Competing interests. The authors have declared that no competing interests exist.

Figures

Figure 1
Figure 1. Gene Expression from the Single Male X Chromosome Is Similar to Expression from Autosome Pairs
(A) Scatter graph of median expression of 11,952 autosomal genes against median expression of 371 X chromosome genes for 105 males. The diagonal indicates the position at which median expression levels from X and autosomes are the same. (B) Median expression for each autosome pair and for X. Medians were calculated for each gene for 30 YRI males, and then medians were calculated for each autosome and for X. Data are ranked in order of increasing median expression.
Figure 2
Figure 2. Limited Contribution of the Xi to Female Gene Expression
(A) Median expression of 11,952 autosome genes (blue) and 371 X genes (red) for 30 YRI males plotted against median expression for 30 females. The red diagonal indicates the expected position of X-linked genes if expression were proportional to copy number. (B) Expression data from 371 X chromosome genes in 105 males and 105 females were normalised to the median of 11,952 autosomal sequences. The mean expression value for males and females in each population is illustrated. Error bars represent +/− 1 standard deviation.
Figure 3
Figure 3. The Proportion of Genes with Higher Female Expression Is Greater from X Than Autosomes
Percentage of X chromosome and autosome genes showing higher expression in females (A–C) or males (D–F) at three levels of significance: p < 0.05, p < 0.01, and p < 0.001. Note that the y-axis scale changes for different levels of significance.
Figure 4
Figure 4. Comparison of Female and Male Expression of Genes with Higher Female Expression
(A) Female to male expression ratio for 20 genes expressed more highly in females in four human populations. Expression in females is typically 10%–50% higher than in males. (B) Box and whisker plots showing the median, distribution, and range of expression for females and males for four X chromosome genes with higher female expression. The median is indicated by the red line, the box shows the interquartile range, and the ends of the whiskers the maxima and minima. The y-axis spans a 4-fold range for each graph to enable direct comparison of different genes. (C) Scatter plot of expression values of four non-dosage compensated genes in 30 males and 30 females from the YRI population. JARID1C is unique as none of the males has higher expression than any of the females. For EIF2S3 the overlap is considerable, as only half the females have higher expression than the highest male and only five males express at a level below the lowest female.
Figure 5
Figure 5. Evidence That Expression of the Y-linked Copy of XY Gene Pairs Can Maintain Dosage Compensation
(A–F) Stacked bars show the cumulative expression of X and Y gametologues in males alongside expression from the X chromosomes in females. Note that the y-axis is a linear scale.
Figure 6
Figure 6. Genes Expressed More Highly in Females Are Distributed Non-Randomly on the X Chromosome
For each gene, the median expression value for males was subtracted from the median expression value for females to give a median difference. Illustrated is the median difference for each gene based on averaging the values for the four populations, plotted according to location on the X chromosome. A median difference of 1 represents a 2-fold difference in expression. Different symbols represent different evolutionary strata. Genes expressed significantly more highly in females are coloured red, and the single gene expressed significantly more highly in males (CD99) is coloured blue.

References

    1. Baker BS, Gorman M, Marin I. Dosage compensation in Drosophila. Annu Rev Genet. 1994;28:491–521. - PubMed
    1. Meller VH, Kuroda MI. Sex and the single chromosome. Adv Genet. 2002;46:1–24. - PubMed
    1. Lyon MF. Gene action in the X-chromosome of the mouse (Mus musculus L.) Nature. 1961;190:372–373. - PubMed
    1. Ohno S. Sex chromosomes and sex-linked genes. Berlin: Springer; 1967.
    1. Nguyen DK, Disteche CM. Dosage compensation of the active X chromosome in mammals. Nat Genet. 2006;38:47–53. - PubMed

Publication types

LinkOut - more resources