. 2008 Oct;12(5B):2096-106.
doi: 10.1111/j.1582-4934.2008.00246.x. Epub 2008 Jan 19.

Transgenic mice overexpressing human G972R IRS-1 show impaired insulin action and insulin secretion

Affiliations

Transgenic mice overexpressing human G972R IRS-1 show impaired insulin action and insulin secretion

Marta L Hribal et al. J Cell Mol Med. 2008 Oct.

Abstract

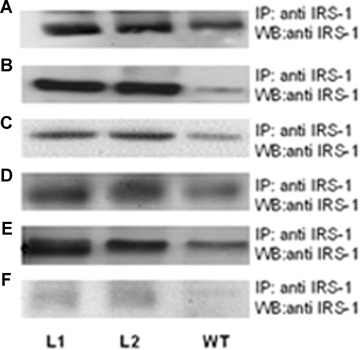
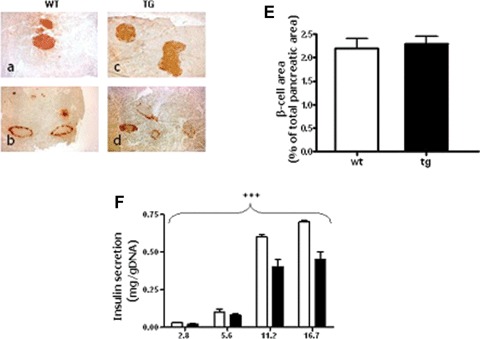
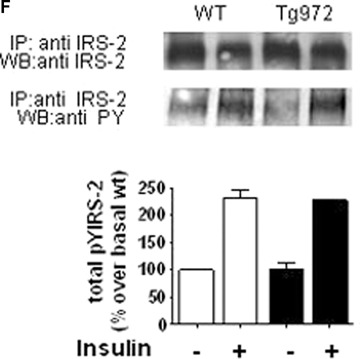
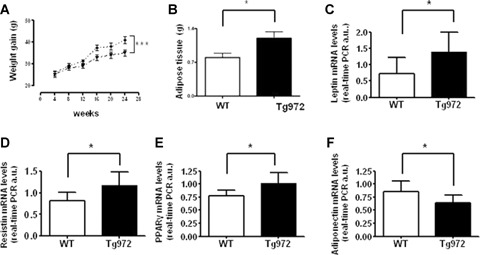
Molecular scanning of human insulin receptor substrate (Irs) genes revealed a single lrs1 prevalent variant, a glycine to arginine change at codon 972 (G972R); previous in vitro studies had demonstrated that the presence of this variant results in an impaired activation of the insulin signalling pathway, while human studies gave controversial results regarding its role in the pathogenesis of insulin resistance and related diseases. To address in vivo impact of this IRS-1 variant on whole body glucose homeostasis and insulin signalling, we have generated transgenic mice overexpressing it (Tg972) and evaluated insulin action in the liver, skeletal muscle and adipose tissue and assessed glucose homeostasis both under a normal diet and a high-fat diet. We found that Tg972 mice developed age-related glucose and insulin intolerance and hyperglycaemia, with insulin levels comparatively low. Glucose utilization and insulin signalling were impaired in all key insulin target tissues in Tg972 mice. There were no differences in pancreatic morphology between Tg972 and wild-type mice, however when insulin secretion was evaluated in isolated islets, it was significantly reduced in Tg972 mice islets at any glucose concentration tested. Under a high-fat diet, Tg972 mice had increased body and adipose tissue weight, and were more prone to develop diet-induced glucose and insulin intolerance. So, we believe that Tg972 mice may represent a useful model to elucidate the interaction between genetic and environmental factors in insulin resistance pathogenesis. Furthermore, they may become an important tool to test novel tailored therapies.


Figures

Fig 1
Fig 1
Metabolic characterization of 3-months and 6-months-old Tg972 mice. Insulin receptor substrate (IRS)-1 overexpression in two Tg972 lines (L1 and L2). Livers (A), skeletal muscles (B), adipose tissues (C), hearts (D), pancreata (E) and purified pancreatic islets (F) from 3-months-old Tg972 and wild-type (WT) male mice were lysed and IRS-1 overexpression was assessed in protein lysates by immunoprecipitation (IP) and subsequent Western Blot (WB) with an anti-IRS-1 antibody. Images shown are representative of five experiments. (G) Fasting glucose/insulin ratio (mg/dl/ ng/ml) in WT and Tg972 mice at 6 months of age. ***P < 0.0001 for Tg972 versus WT mice by Student's t-test (n= 12–14 per genotype). Glucose levels after an intraperitoneal glucose load (IPGTT) in WT (squares) and Tg972 (circles) mice at 3 (H) and 6 months (I) of age. Data are expressed as mean ± SD (n = 5–10 per genotype). **P<0.01, *** P<0.0001 for Tg972 versus WT mice by 2-way anova. Insulin tolerance test (ITT) in WT (squares) and Tg972 (circles) mice at 3 (I) and 6 months (M) of age. Data are expressed as mean ± SD (n = 5–10 per genotype). ** P < 0.01,*** P < 0.0001 for Tg972 versus WT mice by 2-way anova.
Fig 1
Fig 1
Metabolic characterization of 3-months and 6-months-old Tg972 mice. Insulin receptor substrate (IRS)-1 overexpression in two Tg972 lines (L1 and L2). Livers (A), skeletal muscles (B), adipose tissues (C), hearts (D), pancreata (E) and purified pancreatic islets (F) from 3-months-old Tg972 and wild-type (WT) male mice were lysed and IRS-1 overexpression was assessed in protein lysates by immunoprecipitation (IP) and subsequent Western Blot (WB) with an anti-IRS-1 antibody. Images shown are representative of five experiments. (G) Fasting glucose/insulin ratio (mg/dl/ ng/ml) in WT and Tg972 mice at 6 months of age. ***P < 0.0001 for Tg972 versus WT mice by Student's t-test (n= 12–14 per genotype). Glucose levels after an intraperitoneal glucose load (IPGTT) in WT (squares) and Tg972 (circles) mice at 3 (H) and 6 months (I) of age. Data are expressed as mean ± SD (n = 5–10 per genotype). **P<0.01, *** P<0.0001 for Tg972 versus WT mice by 2-way anova. Insulin tolerance test (ITT) in WT (squares) and Tg972 (circles) mice at 3 (I) and 6 months (M) of age. Data are expressed as mean ± SD (n = 5–10 per genotype). ** P < 0.01,*** P < 0.0001 for Tg972 versus WT mice by 2-way anova.
Fig 2
Fig 2
Pancreatic morphology and insulin secretion in Tg972 and WT mice. Representative images of pancreatic sections from 4- to 6-months-old male WT (A, B, n= 4) and Tg972 mice (C, D, n= 4) stained with anti-insulin (A, C) or anti-glucagon antibody (B, d) are shown at a 20x magnification. Six sections were examined for each mouse. (E) Morphometric analysis of β-cell area, β-cell area is expressed as percentage of the total pancreatic area surveyed. Values are derived from six separate sections for each animal and four animals for each genotype and are expressed as mean ± SD. (F) Glucose stimulated insulin secretion in islet isolated from 4- to 6-months-old WT and Tg972 mice. Data are mean ± SD from two different experiments, each performed in quadruplicate. *** P < 0.001 Tg972 versus WT by 2-anova.
Fig 3
Fig 3
G972R IRS-1 variant alters insulin action in peripheral tissues. 2-DOG uptake was evaluated during a glucose tolerance test into skeletal muscle (A) and adipose tissue (B) from 6-months-old WT and Tg972 littermates. (C) Glucose uptake into liver, as estimated by 2-DOG incorporation into glycogen. Data in A-C represent moles/milligram protein per minute and are expressed as mean ± SD. (n = 5 per genotype) *P < 0.05, ** P < 0.01,*** P < 0.0001 for Tg972 versus WT mice by Student’ s t-test.
Fig 4
Fig 4
G972R IRS-1 variant alters upstream insulin signalling. After a 6 hrs fast, 3–4-months-old male WT and Tg972 mice were injected with 5 U of insulin and livers were collected as indicated in methods. For upstream insulin signalling analysis, insulin-stimulated IRS-1 total tyrosine phosphorylation (pTyr) (A, upper panel), its association with PI3K p85 subunit (A, middle panel), and IRS-1 phosphorylation on Tyrosine 941 and Tyrosine 989 (A, lower panels) were determined by immunoprecipitating with antibody against IRS-1 and immunoblotting with the indicated antibodies. Band intensities were quantified by den-sitometry; and the values obtained for IRS-1 total tyrosine phosphorylation (B), IRS-1 associated p85 (C) and IRS-1 Tyr941 (D) and Tyr989 (E) phosphorylation were normalized for IRS-1 overexpression and reported as mean ± SD. Images from 1 out of 5 experiments are shown. *P<0.05,***P<0.0001 for insulin-stimulated Tg972 versus insulin-stimulated WT by Student's t-test (n = 4 per genotype) (F) Protein extracts were immunoprecipitated with antibodies against IRS-2 and immunoblotted with antibodies against IRS-2 or anti-phos-photyrosine. Band intensities were quantified by densitometry and expressed as mean ± SD. Images from 1 out of 3 experiments are shown (n = 3 per genotype).
Fig 4
Fig 4
G972R IRS-1 variant alters upstream insulin signalling. After a 6 hrs fast, 3–4-months-old male WT and Tg972 mice were injected with 5 U of insulin and livers were collected as indicated in methods. For upstream insulin signalling analysis, insulin-stimulated IRS-1 total tyrosine phosphorylation (pTyr) (A, upper panel), its association with PI3K p85 subunit (A, middle panel), and IRS-1 phosphorylation on Tyrosine 941 and Tyrosine 989 (A, lower panels) were determined by immunoprecipitating with antibody against IRS-1 and immunoblotting with the indicated antibodies. Band intensities were quantified by den-sitometry; and the values obtained for IRS-1 total tyrosine phosphorylation (B), IRS-1 associated p85 (C) and IRS-1 Tyr941 (D) and Tyr989 (E) phosphorylation were normalized for IRS-1 overexpression and reported as mean ± SD. Images from 1 out of 5 experiments are shown. *P<0.05,***P<0.0001 for insulin-stimulated Tg972 versus insulin-stimulated WT by Student's t-test (n = 4 per genotype) (F) Protein extracts were immunoprecipitated with antibodies against IRS-2 and immunoblotted with antibodies against IRS-2 or anti-phos-photyrosine. Band intensities were quantified by densitometry and expressed as mean ± SD. Images from 1 out of 3 experiments are shown (n = 3 per genotype).
Fig 5
Fig 5
G972R IRS-1 variant alters downstream insulin signalling. After a 6 hrs fast, 3–4-months-old male WT and Tg972 mice were injected with 5 U of insulin and livers (A, D), skeletal muscle (B) and adipose tissue (C) were collected as indicated in methods (n = 4–8 per genotype). To detect insulin action in peripheral tissues, protein extracts were immunoblotted with antibodies against phosphorylated Akt (A, B, C; upper panels) or phosphory-lated GSK3 (D; upper panel). Levels of total Akt (A, B, C; lower panels) and total GSK3 (D; lower panel) were determined by blotting the original lysates. Band intensities were quantified by densitometry and expressed as mean ± SD. Images from one out of five experiments are shown. *P<0.05, **P<0.01 for insulin-stimulated Tg972 vs insulin-stimulated WT by Student's t-test.
Fig 6
Fig 6
Increased obesity, adipokines expression and effect of high fat diet on glucose homeostasis in HFD Tg972 mice. Body (A) and adipose tissue (B) weight of Tg972 and WT mice on high-fat diet (HFD). Data are expressed as mean ± SD (n = 15 per genotype) * P < 0.05, ***P < 0.001 for HFD Tg972 versus HFD WTby2-wayAN0VA. Leptin (C), resistin (D), peroxisome proliterator activated receptor-y (PPAR-y) (E) and adiponectin (F) mRNA levels Data are mean ± SD from two separate experiments, each performed in triplicate. * P<0.05 for HFD Tg972 versus HFD WT by Student's t-test (n = 6–8 per genotype). (G) Glucose levels after intraperitoneal glucose load in 3-months-old HFD WT (triangles) and HFD Tg972 (diamonds). Data are expressed as mean ± SD (n = 8–12 per group). ***p < 0.0001 for HFD Tg972 mice versus HFD WT by 2-way ANOVA. (H) Insulin tolerance test (0, 75 U/Kg) in 3-months-old HFD WT (triangles) and HFD Tg972 (diamonds). Data are expressed as mean ± SD (n = 8–10 per group).***P<0.0001 for HFD Tg972 mice versus HFD WT mice by 2-way ANOVA. (I) Glucose levels after intraperitoneal glucose load in 6-months-old HFD WT (triangles) and HFD Tg972 (diamonds). Data are expressed as mean ± SD (n = 2–5 per group). ***P<0.0001 for HFD Tg972 mice versus HFD WT by 2-way anova. Insulin (L) concentrations at 0 and 120 min. during IPGTT in 6-months-old HFD WT and HFD Tg972 mice. Data are expressed as mean ± SD (n = 5–8 per genotype). **P < 0.01,***P < 0.0001 for HFD Tg972 mice versus HFD WT mice by Student's t-test.
Fig 6
Fig 6
Increased obesity, adipokines expression and effect of high fat diet on glucose homeostasis in HFD Tg972 mice. Body (A) and adipose tissue (B) weight of Tg972 and WT mice on high-fat diet (HFD). Data are expressed as mean ± SD (n = 15 per genotype) * P < 0.05, ***P < 0.001 for HFD Tg972 versus HFD WTby2-wayAN0VA. Leptin (C), resistin (D), peroxisome proliterator activated receptor-y (PPAR-y) (E) and adiponectin (F) mRNA levels Data are mean ± SD from two separate experiments, each performed in triplicate. * P<0.05 for HFD Tg972 versus HFD WT by Student's t-test (n = 6–8 per genotype). (G) Glucose levels after intraperitoneal glucose load in 3-months-old HFD WT (triangles) and HFD Tg972 (diamonds). Data are expressed as mean ± SD (n = 8–12 per group). ***p < 0.0001 for HFD Tg972 mice versus HFD WT by 2-way ANOVA. (H) Insulin tolerance test (0, 75 U/Kg) in 3-months-old HFD WT (triangles) and HFD Tg972 (diamonds). Data are expressed as mean ± SD (n = 8–10 per group).***P<0.0001 for HFD Tg972 mice versus HFD WT mice by 2-way ANOVA. (I) Glucose levels after intraperitoneal glucose load in 6-months-old HFD WT (triangles) and HFD Tg972 (diamonds). Data are expressed as mean ± SD (n = 2–5 per group). ***P<0.0001 for HFD Tg972 mice versus HFD WT by 2-way anova. Insulin (L) concentrations at 0 and 120 min. during IPGTT in 6-months-old HFD WT and HFD Tg972 mice. Data are expressed as mean ± SD (n = 5–8 per genotype). **P < 0.01,***P < 0.0001 for HFD Tg972 mice versus HFD WT mice by Student's t-test.

References

    1. Taniguchi CM, Emmanuelli B, Kahn CR. Critical nodes in signalling pathways: insights into insulin action. Nat Rev Mol Cell Biol. 2006;7:85–96. - PubMed
    1. Sesti G, Federici M, Hribal ML, Lauro D, Sbraccia P, Lauro R. Defects of the insulin receptor (IRS) system in human metabolic disorders. Faseb J. 2001;15:2099–111. - PubMed
    1. Almind K, Bjorbaek C, Vestergaard H, Hanset T, Echwald S, Pedersen O. Aminoacid polymorphism of insulin receptor substrate-1 in non-insulin-dependent diabetes mellitus. Lancet. 1993;342:828–32. - PubMed
    1. Imai Y, Fusco A, Suzuki Y, Lesniak MA, D’Alfonso R, Sesti G, Bertoli A, Lauro R, Accili D, Taylor SI. Variant sequences of IRS-1 in patients with noninsulin-depend-ent diabetes mellitus. J Clln Endocrlnol Metab. 1994;79:1655–8. - PubMed
    1. Almind K, Inoue G, Pedersen O, Kahn CR. A common amino acid polymorphism in insulin receptor substrate-1 causes impaired insulin signaling. Evidence from transgene studies. J Clln Invest. 1996;97:2569–75. - PMC - PubMed

Publication types

MeSH terms