

SignS: a parallelized, open-source, freely available, web-based tool for gene selection and molecular signatures for survival and censored data
- PMID: 18208605
- PMCID: PMC2265264
- DOI: 10.1186/1471-2105-9-30
SignS: a parallelized, open-source, freely available, web-based tool for gene selection and molecular signatures for survival and censored data
Abstract
Background: Censored data are increasingly common in many microarray studies that attempt to relate gene expression to patient survival. Several new methods have been proposed in the last two years. Most of these methods, however, are not available to biomedical researchers, leading to many re-implementations from scratch of ad-hoc, and suboptimal, approaches with survival data.
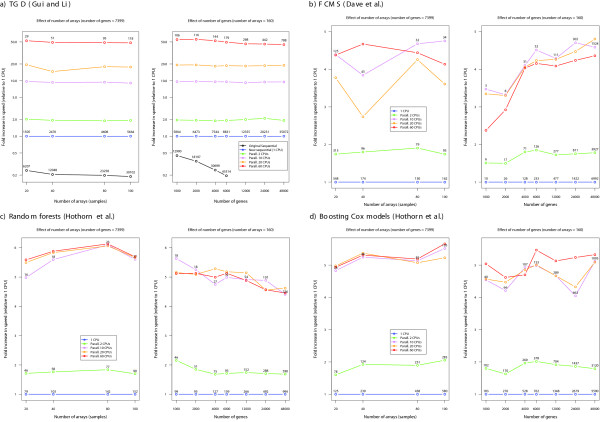
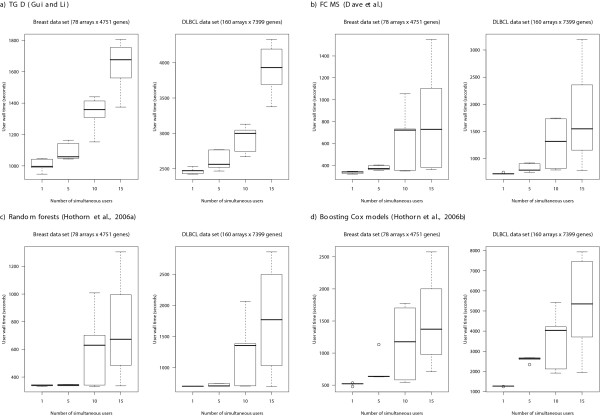
Results: We have developed SignS (Signatures for Survival data), an open-source, freely-available, web-based tool and R package for gene selection, building molecular signatures, and prediction with survival data. SignS implements four methods which, according to existing reviews, perform well and, by being of a very different nature, offer complementary approaches. We use parallel computing via MPI, leading to large decreases in user waiting time. Cross-validation is used to asses predictive performance and stability of solutions, the latter an issue of increasing concern given that there are often several solutions with similar predictive performance. Biological interpretation of results is enhanced because genes and signatures in models can be sent to other freely-available on-line tools for examination of PubMed references, GO terms, and KEGG and Reactome pathways of selected genes.
Conclusion: SignS is the first web-based tool for survival analysis of expression data, and one of the very few with biomedical researchers as target users. SignS is also one of the few bioinformatics web-based applications to extensively use parallelization, including fault tolerance and crash recovery. Because of its combination of methods implemented, usage of parallel computing, code availability, and links to additional data bases, SignS is a unique tool, and will be of immediate relevance to biomedical researchers, biostatisticians and bioinformaticians.
Figures
Similar articles
-
GeneSrF and varSelRF: a web-based tool and R package for gene selection and classification using random forest.BMC Bioinformatics. 2007 Sep 3;8:328. doi: 10.1186/1471-2105-8-328. BMC Bioinformatics. 2007. PMID: 17767709 Free PMC article.
-
ADaCGH: A parallelized web-based application and R package for the analysis of aCGH data.PLoS One. 2007 Aug 15;2(8):e737. doi: 10.1371/journal.pone.0000737. PLoS One. 2007. PMID: 17710137 Free PMC article.
-
Asterias: integrated analysis of expression and aCGH data using an open-source, web-based, parallelized software suite.Nucleic Acids Res. 2007 Jul;35(Web Server issue):W75-80. doi: 10.1093/nar/gkm229. Epub 2007 May 8. Nucleic Acids Res. 2007. PMID: 17488846 Free PMC article.
-
Pomelo II: finding differentially expressed genes.Nucleic Acids Res. 2009 Jul;37(Web Server issue):W581-6. doi: 10.1093/nar/gkp366. Epub 2009 May 12. Nucleic Acids Res. 2009. PMID: 19435879 Free PMC article.
-
Freely accessible software for recruitment prediction and recruitment monitoring of clinical trials: A systematic review.Contemp Clin Trials Commun. 2024 Apr 22;39:101298. doi: 10.1016/j.conctc.2024.101298. eCollection 2024 Jun. Contemp Clin Trials Commun. 2024. PMID: 38689828 Free PMC article. Review.
Cited by
-
Vitamin D receptor expression and associated gene signature in tumour stromal fibroblasts predict clinical outcome in colorectal cancer.Gut. 2017 Aug;66(8):1449-1462. doi: 10.1136/gutjnl-2015-310977. Epub 2016 Apr 6. Gut. 2017. PMID: 27053631 Free PMC article.
-
CMA: a comprehensive Bioconductor package for supervised classification with high dimensional data.BMC Bioinformatics. 2008 Oct 16;9:439. doi: 10.1186/1471-2105-9-439. BMC Bioinformatics. 2008. PMID: 18925941 Free PMC article.
-
DNA methylation profiles and their relationship with cytogenetic status in adult acute myeloid leukemia.PLoS One. 2010 Aug 16;5(8):e12197. doi: 10.1371/journal.pone.0012197. PLoS One. 2010. PMID: 20808941 Free PMC article.
-
Integrative genome-wide gene expression profiling of clear cell renal cell carcinoma in Czech Republic and in the United States.PLoS One. 2013;8(3):e57886. doi: 10.1371/journal.pone.0057886. Epub 2013 Mar 5. PLoS One. 2013. PMID: 23526956 Free PMC article.
-
TGF-β-induced IGFBP-3 is a key paracrine factor from activated pericytes that promotes colorectal cancer cell migration and invasion.Mol Oncol. 2020 Oct;14(10):2609-2628. doi: 10.1002/1878-0261.12779. Epub 2020 Sep 1. Mol Oncol. 2020. PMID: 32767843 Free PMC article.
References
-
- Dave SS, Wright G, Tan B, Rosenwald A, Gascoyne RD, Chan WC, Fisher RI, Braziel RM, Rimsza LM, Grogan TM, Miller TP, LeBlanc M, Greiner TC, Weisenburger DD, Lynch JC, Vose J, Armitage JO, Smeland EB, Kvaloy S, Holte H, Delabie J, Connors JM, Lansdorp PM, Ouyang Q, Lister TA, Davies AJ, Norton AJ, Muller-Hermelink HK, Ott G, Campo E, Montserrat E, Wilson WH, Jaffe ES, Simon R, Yang L, Powell J, Zhao H, Goldschmidt N, Chiorazzi M, Staudt LM. Prediction of survival in follicular lymphoma based on molecular features of tumor-infiltrating immune cells. N Engl J Med. 2004;351:2159–2169. - PubMed
-
- Gui J, Li H. Threshold gradient descent method for censored data regression with applications in pharmacogenomics. Pac Symp Biocomput. 2005:272–283. - PubMed
-
- Hothorn T, Bühlmann P, Dudoit S, Molinaro A, van der Laan MJ. Survival Ensembles. Biostatistics. 2006;7:355–373. - PubMed
-
- Bair R, Hastie T, Paul D, Tibshirani R. Prediction by Supervised Principal Components. Journal American Statistical Association. 2006;101:119–137.
