Impaired object manipulation in mildly involved individuals with multiple sclerosis
- PMID: 18209246
- PMCID: PMC2605732
- DOI: 10.1123/mcj.12.1.3
Impaired object manipulation in mildly involved individuals with multiple sclerosis
Abstract
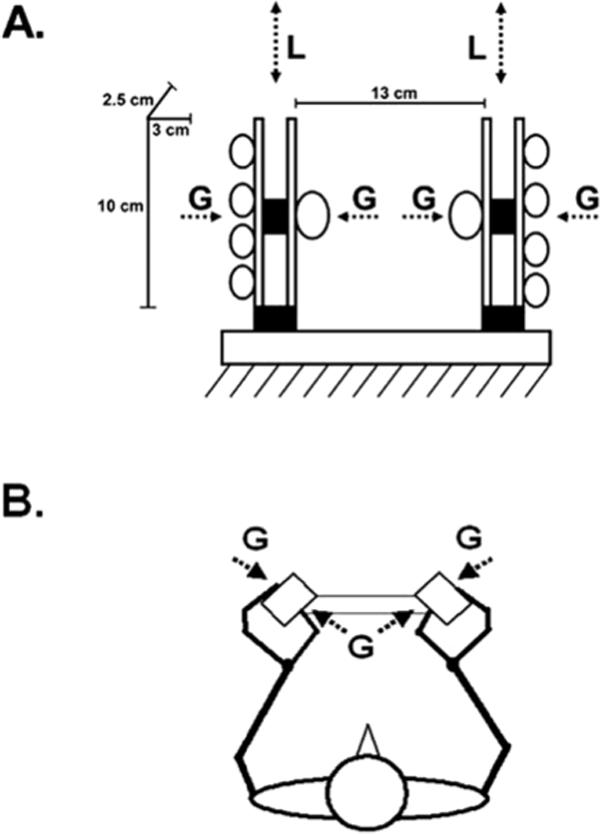
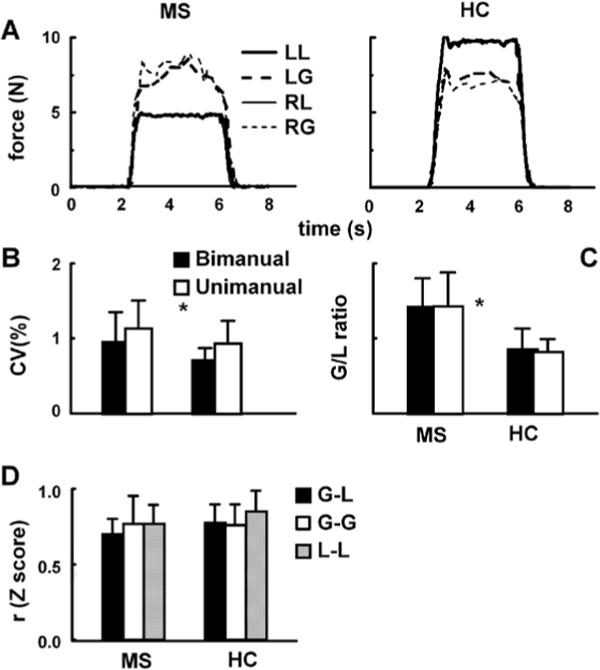
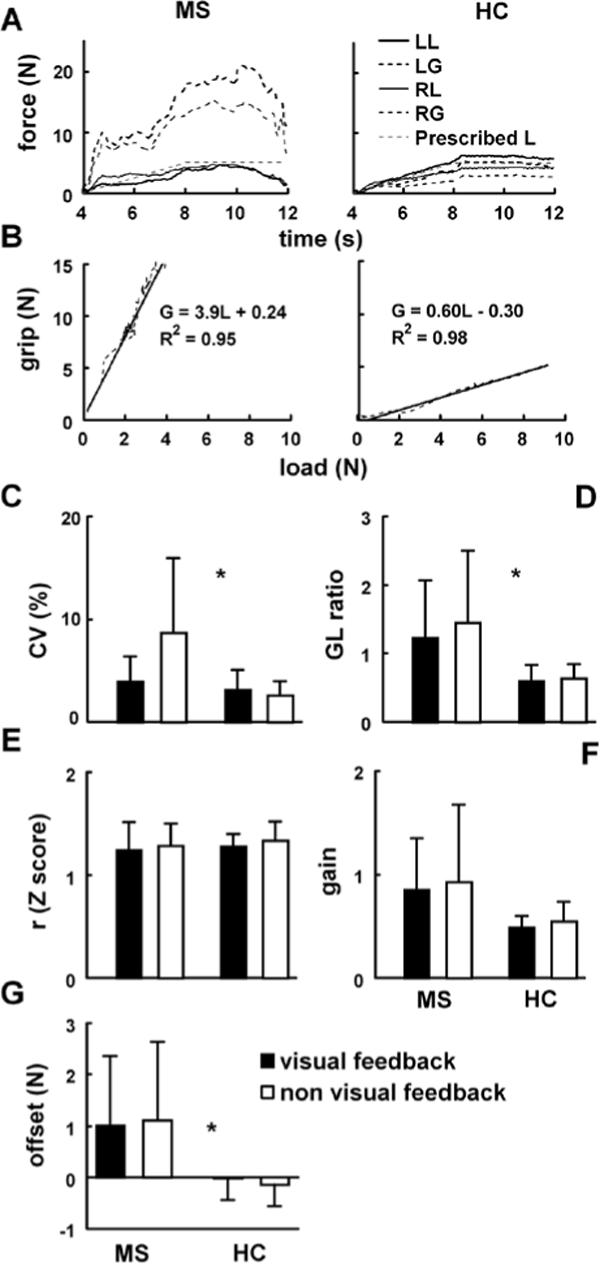
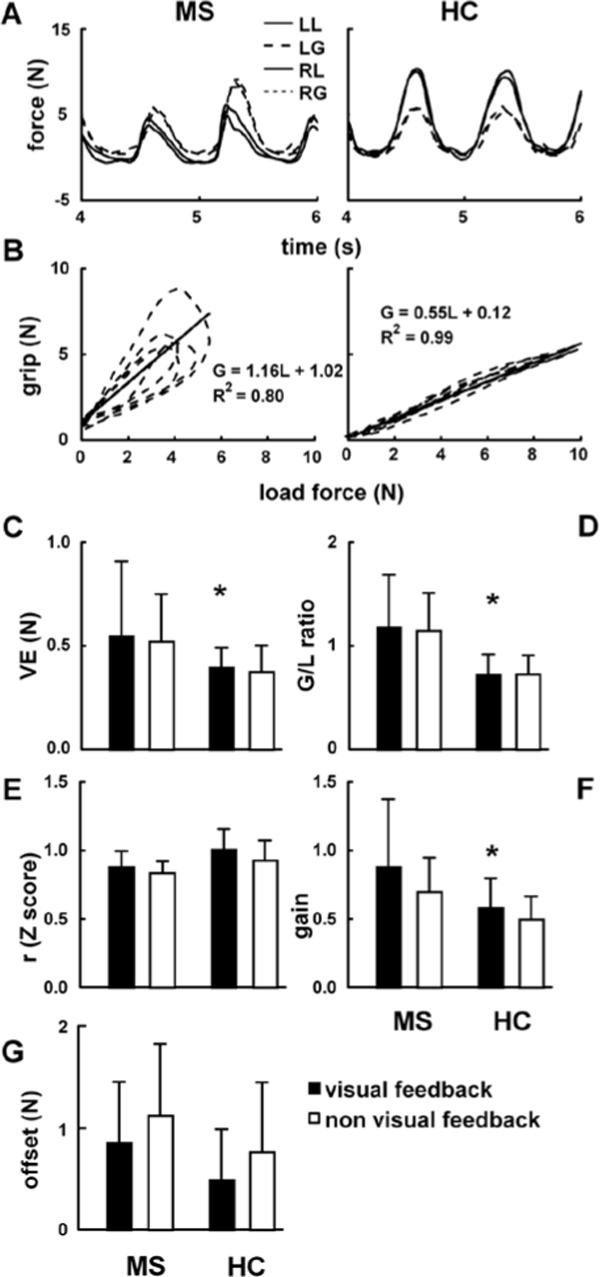
We investigated hand function in mildly involved multiple sclerosis (MS) patients (N = 16; Expanded Disability Status Scale 1-5, 9-hole peg test 14-32 s) during static and dynamic manipulation tasks using an instrumented device. When compared with healthy controls (N = 16), the patients revealed impaired task performance regarding their ability to exert prescribed patterns of load force (L; force acting tangentially at the digits-object surface). Regarding the coordination of grip force (G; normal component) and L, the data only revealed an elevated G/L ratio, although both the G and L coupling (maximum correlation coefficients and the time lags between them) and the G modulation (gain and offset of G with respect to L) remained comparable in the two groups. Finally, most of the data suggested no MS-specific effects of switching from uni- to bimanual tasks, from available visual feedback to deprived feedback conditions. We conclude that the deterioration in the ability for precise control of external forces and overgripping could precede the decoupling of G and L and decreased G modulation in early phases of the disease. The results also suggest that the applied methodology could be sensitive enough to detect mild levels of impairment of hand function in MS and, possibly, other neurological diseases.
Figures
Similar articles
-
Hand function in multiple sclerosis: force coordination in manipulation tasks.Clin Neurophysiol. 2008 Oct;119(10):2274-81. doi: 10.1016/j.clinph.2008.06.011. Epub 2008 Aug 28. Clin Neurophysiol. 2008. PMID: 18760664 Free PMC article.
-
Load and grip force coordination in static bimanual manipulation tasks in multiple sclerosis.Motor Control. 2006 Apr;10(2):160-77. doi: 10.1123/mcj.10.2.160. Motor Control. 2006. PMID: 16871011
-
Interlimb and within limb force coordination in static bimanual manipulation task.Exp Brain Res. 2006 Jan;168(1-2):88-97. doi: 10.1007/s00221-005-0070-6. Epub 2005 Aug 3. Exp Brain Res. 2006. PMID: 16078026
-
Mitoxantrone: a review of its use in multiple sclerosis.CNS Drugs. 2004;18(6):379-96. doi: 10.2165/00023210-200418060-00010. CNS Drugs. 2004. PMID: 15089110 Review.
-
Objective evaluation of manual performance deficits in neurological movement disorders.Brain Res Rev. 2006 Jun;51(1):108-24. doi: 10.1016/j.brainresrev.2005.10.003. Epub 2005 Dec 13. Brain Res Rev. 2006. PMID: 16356552 Review.
Cited by
-
Two-dimensional static manipulation tasks: does force coordination depend on change of the tangential force direction?Exp Brain Res. 2012 Oct;222(4):365-75. doi: 10.1007/s00221-012-3221-6. Epub 2012 Aug 25. Exp Brain Res. 2012. PMID: 22923208
-
Force coordination in static manipulation tasks performed using standard and non-standard grasping techniques.Exp Brain Res. 2009 Apr;194(4):605-18. doi: 10.1007/s00221-009-1738-0. Epub 2009 Feb 27. Exp Brain Res. 2009. PMID: 19247643
-
The kinematics of handwriting movements as expression of cognitive and sensorimotor impairments in people with multiple sclerosis.Sci Rep. 2017 Dec 18;7(1):17730. doi: 10.1038/s41598-017-18066-7. Sci Rep. 2017. PMID: 29255220 Free PMC article.
-
Assessment of hand function through the coordination of contact forces in manipulation tasks.J Hum Kinet. 2013 Mar 28;36:5-15. doi: 10.2478/hukin-2013-0001. Print 2013 Mar. J Hum Kinet. 2013. PMID: 23717350 Free PMC article.
-
Impaired Object Handling during Bimanual Task Performance in Multiple Sclerosis.Mult Scler Int. 2014;2014:450420. doi: 10.1155/2014/450420. Epub 2014 Aug 6. Mult Scler Int. 2014. PMID: 25170424 Free PMC article.
References
-
- Andres FG, Mima T, Schulman AE, Dichgans J, Hallett M, Gerloff C. Functional coupling of human cortical sensorimotor areas during bimanual skill acquisition. Brain. 1999;122(Pt 5):855–870. - PubMed
-
- Cerasa A, Fera F, Gioia MC, Liguori M, Passamonti L, Nicoletti G, et al. Adaptive cortical changes and the functional correlates of visuo-motor integration in relapsing-remitting multiple sclerosis. Brain Research Bulletin. 2006;69(6):597–605. - PubMed
-
- Duque J, Thonnard JL, Vandermeeren Y, Sebire G, Cosnard G, Olivier E. Correlation between impaired dexterity and corticospinal tract dysgenesis in congenital hemiplegia. Brain. 2003;126:732–747. - PubMed
Publication types
MeSH terms
Grants and funding
LinkOut - more resources
Full Text Sources
Medical