. 2008 Jan 22:8:5.
doi: 10.1186/1471-2229-8-5.

Quantitative 1H NMR metabolomics reveals extensive metabolic reprogramming of primary and secondary metabolism in elicitor-treated opium poppy cell cultures

Affiliations

Quantitative 1H NMR metabolomics reveals extensive metabolic reprogramming of primary and secondary metabolism in elicitor-treated opium poppy cell cultures

Katherine G Zulak et al. BMC Plant Biol. .

Abstract

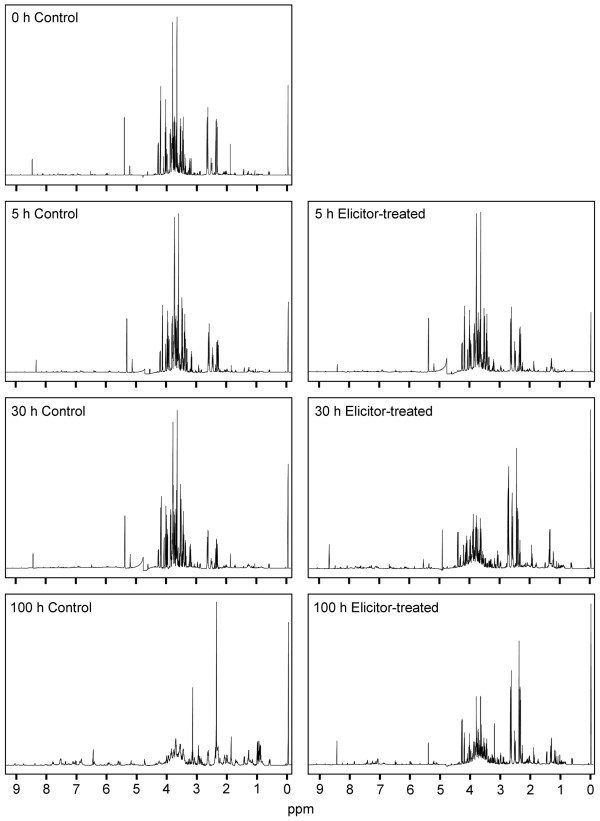
Background: Opium poppy (Papaver somniferum) produces a diverse array of bioactive benzylisoquinoline alkaloids and has emerged as a model system to study plant alkaloid metabolism. The plant is cultivated as the only commercial source of the narcotic analgesics morphine and codeine, but also produces many other alkaloids including the antimicrobial agent sanguinarine. Modulations in plant secondary metabolism as a result of environmental perturbations are often associated with the altered regulation of other metabolic pathways. As a key component of our functional genomics platform for opium poppy we have used proton nuclear magnetic resonance (1H NMR) metabolomics to investigate the interplay between primary and secondary metabolism in cultured opium poppy cells treated with a fungal elicitor.

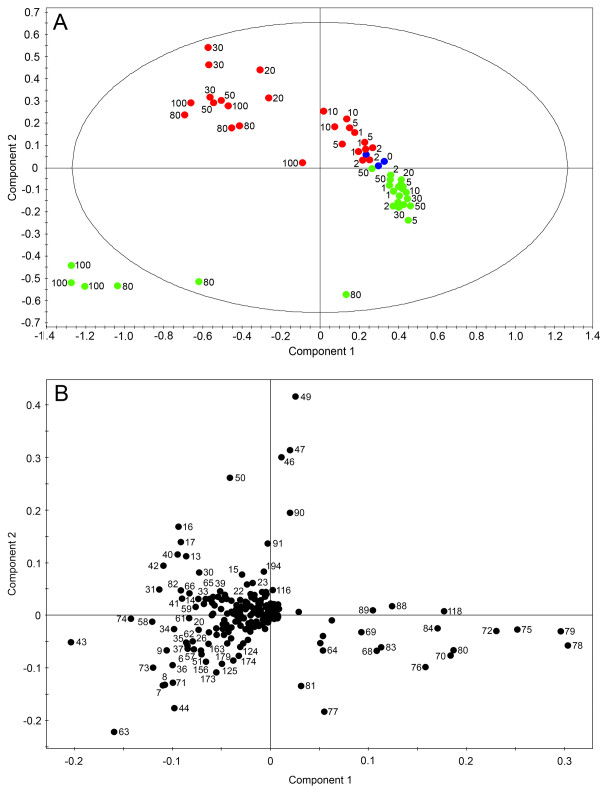
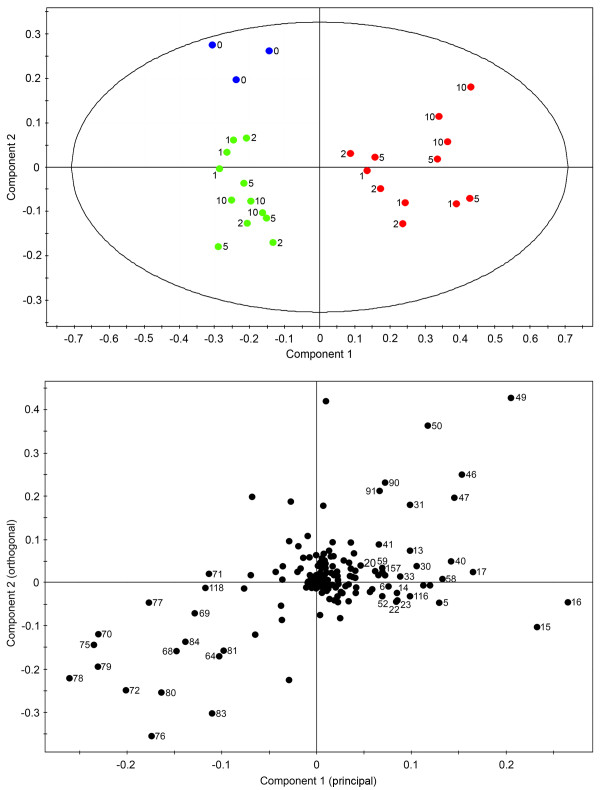
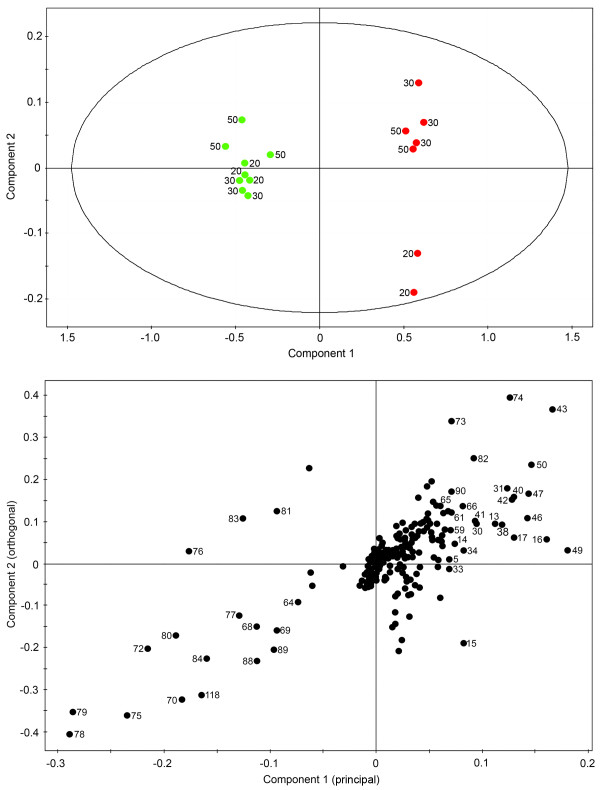
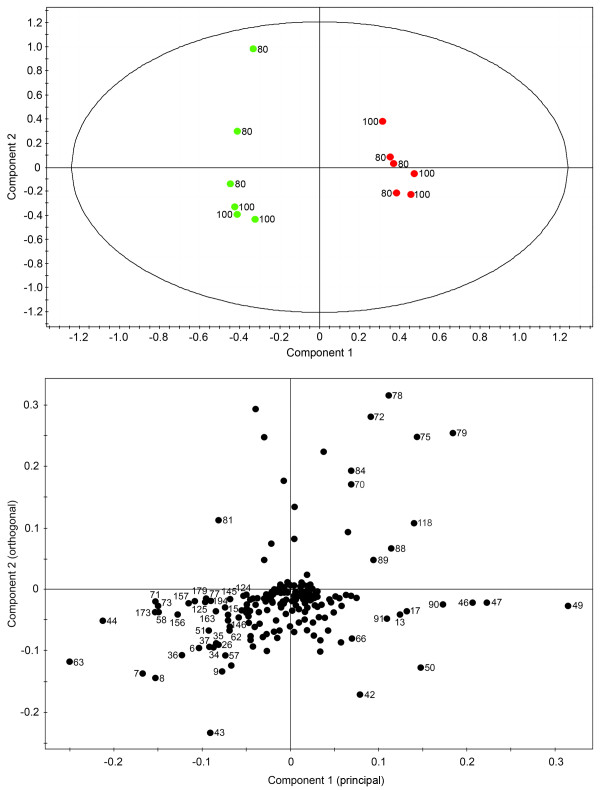
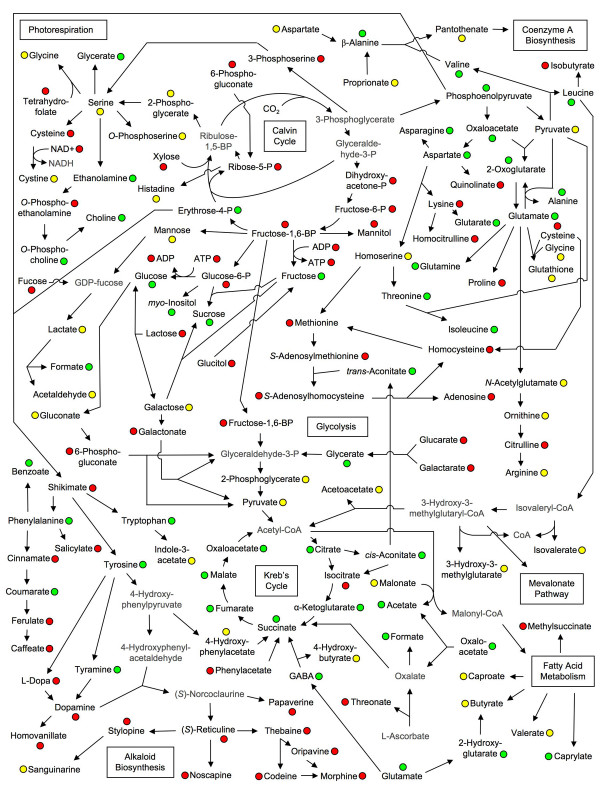
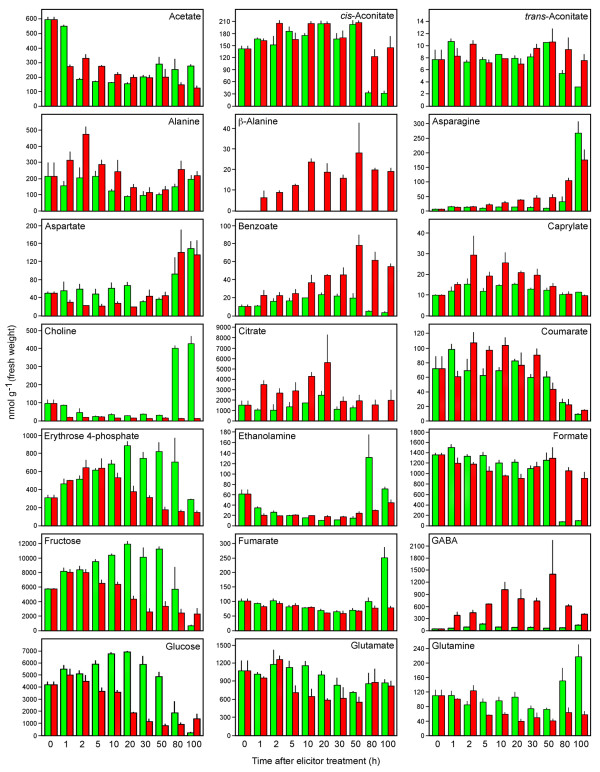
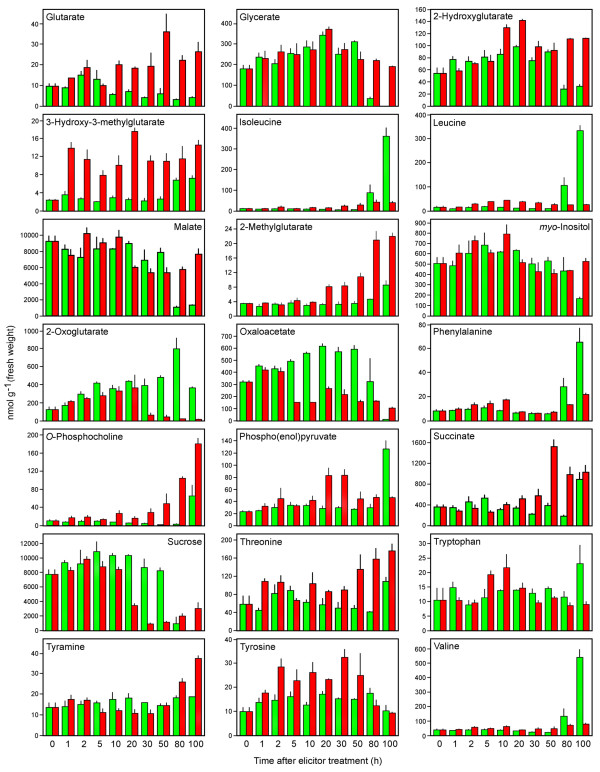
Results: Metabolite fingerprinting and compound-specific profiling showed the extensive reprogramming of primary metabolic pathways in association with the induction of alkaloid biosynthesis in response to elicitor treatment. Using Chenomx NMR Suite v. 4.6, a software package capable of identifying and quantifying individual compounds based on their respective signature spectra, the levels of 42 diverse metabolites were monitored over a 100-hour time course in control and elicitor-treated opium poppy cell cultures. Overall, detectable and dynamic changes in the metabolome of elicitor-treated cells, especially in cellular pools of carbohydrates, organic acids and non-protein amino acids were detected within 5 hours after elicitor treatment. The metabolome of control cultures also showed substantial modulations 80 hours after the start of the time course, particularly in the levels of amino acids and phospholipid pathway intermediates. Specific flux modulations were detected throughout primary metabolism, including glycolysis, the tricarboxylic acid cycle, nitrogen assimilation, phospholipid/fatty acid synthesis and the shikimate pathway, all of which generate secondary metabolic precursors.

Conclusion: The response of cell cultures to elicitor treatment involves the extensive reprogramming of primary and secondary metabolism, and associated cofactor biosynthetic pathways. A high-resolution map of the extensive reprogramming of primary and secondary metabolism in elicitor-treated opium poppy cell cultures is provided.


Figures

Figure 1
Figure 1
1H NMR spectra of D2O extracts from control and elicitor-treated opium poppy cell culture collected 0, 5, 30 and 100 h post-elicitation. 2,2-Dimethyl-2-silapentane-5-sulfonate (DSS) was used as an internal standard. The peak height of DSS, which was set at 0 ppm, is equivalent for all spectra.
Figure 2
Figure 2
Scores (A) and corresponding loadings plot (B) of principal component analysis (PCA) on 1H NMR spectra for D2O extracts of control (green) and elicitor-treated (red) opium poppy cell cultures collected at different time points post-elicitation. The ellipse in A represents the Hotelling with 95% confidence. Numbers beside data point on the loadings plot correspond to specific bins used in the analysis.
Figure 3
Figure 3
Scores (A) and corresponding loadings plot (B) of orthogonal partial least-squares-discriminant analysis (OPLS-DA) on 1H NMR spectra for D2O extracts of control (green) and elicitor-treated (red) opium poppy cell cultures collected at 0, 1, 2, 5, and 10 h post-elicitation. The ellipse in A represents the Hotelling with 95% confidence. Numbers beside data point on the loadings plot correspond to specific bins used in the analysis.
Figure 4
Figure 4
Scores (A) and corresponding loadings plot (B) of orthogonal partial least-squares-discriminant analysis (OPLS-DA) on 1H NMR spectra for D2O extracts of control (green) and elicitor-treated (red) opium poppy cell cultures collected at 20, 30 and 50 h post-elicitation. The ellipse in A represents the Hotelling with 95% confidence. Numbers beside data point on the loadings plot correspond to specific bins used in the analysis.
Figure 5
Figure 5
Scores (A) and corresponding loadings plot (B) of orthogonal partial least-squares-discriminant analysis (OPLS-DA) on 1H NMR spectra for D2O extracts of control (green) and elicitor-treated (red) opium poppy cell cultures collected at 80 and 100 h post-elicitation. The ellipse in A represents the Hotelling with 95% confidence. Numbers beside data point on the loadings plot correspond to specific bins used in the analysis.
Figure 6
Figure 6
Metabolite linkage map representing primary and secondary plant metabolism in opium poppy. The circles associated with each metabolite indicate whether the metabolite was detected (green), not detected (red) or masked (yellow). Data could not be obtained for metabolites shown in grey because information regarding their standard 1H NMR spectra was not available.
Figure 7
Figure 7
Quantification of identified metabolites (acetate to glutamine, alphabetically) in control (green) and elicitor-treated (red) opium poppy cell cultures at different time points post-elicitation. Data are given as means ± SEM, which were calculated using three biological replicates. Quantification was achieved using Chenomx NMR Suite v. 4.6 with DSS as the internal standard.
Figure 8
Figure 8
Quantification of identified metabolites (glutarate to valine, alphabetically) in control (green) and elicitor-treated (red) opium poppy cell cultures at different time points post-elicitation. Data are given as means ± SEM, which were calculated using three biological replicates. Quantification was achieved using Chenomx NMR Suite v. 4.6 with DSS as the internal standard.

References

    1. Samanani N, Liscombe DK, Facchini PJ. Molecular cloning and characterization of norcoclaurine synthase, an enzyme catalyzing the first committed step in benzylisoquinoline alkaloid biosynthesis. Plant J. 2004;40:302–313. - PubMed
    1. Liscombe DK, MacLeod BP, Loukanina N, Nandi O, Facchini PJ. Evidence for the monophyletic evolution of benzylisoquinoline alkaloid biosynthesis in angiosperms. Phytochemistry. 2005;66:1374–1393. - PubMed
    1. Facchini PJ. Regulation of alkaloid biosynthesis in plants. Alkaloids Chem Biol. 2006;63:1–44. - PubMed
    1. Facchini PJ, DeLuca V. Phloem-specific expression of tyrosine/dopa decarboxylase and isoquinoline alkaloid biosynthesis in opium poppy. Plant Cell. 1995;7:1811–1821. - PMC - PubMed
    1. Bird DA, Franceschi V, Facchini PJ. A tale of three cell types: alkaloid biosynthesis is localized to sieve elements in opium poppy. Plant Cell. 2003;15:2626–2635. - PMC - PubMed

Publication types