. 2008 Mar 15;94(6):2106-14.
doi: 10.1529/biophysj.107.118562. Epub 2008 Jan 22.

Single particle image reconstruction of the human recombinant Kv2.1 channel

Affiliations

Single particle image reconstruction of the human recombinant Kv2.1 channel

Brian Adair et al. Biophys J. .

Abstract

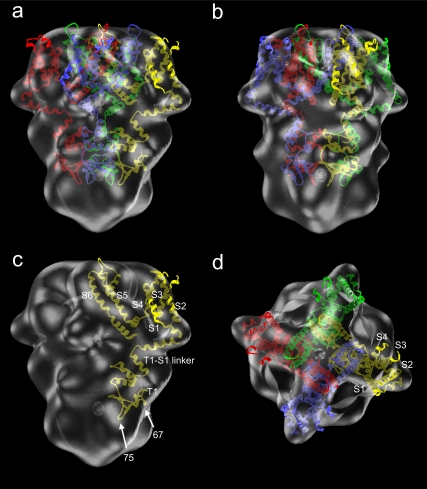
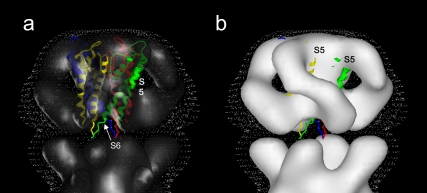
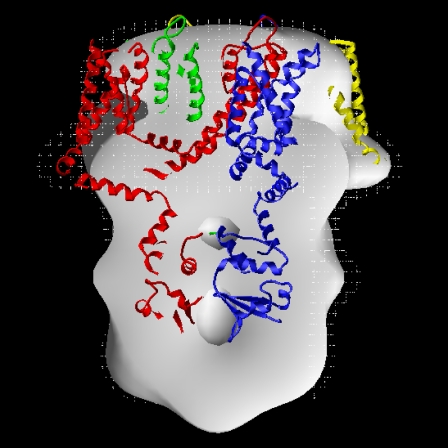
Kv2.1 channels are widely expressed in neuronal and endocrine cells and generate slowly activating K+ currents, which contribute to repolarization in these cells. Kv2.1 is expressed at high levels in the mammalian brain and is a major component of the delayed rectifier current in the hippocampus. In addition, Kv2.1 channels have been implicated in the regulation of membrane repolarization, cytoplasmic calcium levels, and insulin secretion in pancreatic beta-cells. They are therefore an important drug target for the treatment of Type II diabetes mellitus. We used electron microscopy and single particle image analysis to derive a three-dimensional density map of recombinant human Kv2.1. The tetrameric channel is egg-shaped with a diameter of approximately 80 A and a long axis of approximately 120 A. Comparison to known crystal structures of homologous domains allowed us to infer the location of the cytoplasmic and transmembrane assemblies. There is a very good fit of the Kv1.2 crystal structure to the assigned transmembrane assembly of Kv2.1. In other low-resolution maps of K+ channels, the cytoplasmic N-terminal and transmembrane domains form separate rings of density. In contrast, Kv2.1 displays contiguous density that connects the rings, such that there are no large windows between the channel interior and the cytoplasmic space. The crystal structure of KcsA is thought to be in a closed conformation, and the good fit of the KcsA crystal structure to the Kv2.1 map suggests that our preparations of Kv2.1 may also represent a closed conformation. Substantial cytoplasmic density is closely associated with the T1 tetramerization domain and is ascribed to the approximately 184 kDa C-terminal regulatory domains within each tetramer.


Figures

FIGURE 1
FIGURE 1
Sequence comparisons of voltage gated K+ channels Kv2.1, Kv1.2, Shaker, KvAP, and KcsA. Sequence alignment was carried out with the program Clustal W (44). Protein sequences are indicated by shaded bars. Solid regions delineate the conserved sequences discussed in the text. S1–S6, TM domains; P, selectivity filter. Sequences of human Kv2.1 (NP_004966.1 gi:4826784) and Kv1.2 (P08510 gi:13432103) are from SwissProt.
FIGURE 2
FIGURE 2
Purification of Kv2.1 channels. (a) Chromatogram of anion-exchange purification of DHPC-solubilized Kv2.1 from CHO cells. Solid line corresponds to absorbance of eluate at 280 nm. Dashed line corresponds to NaCl concentration of elution buffer. FT (flow through) and specific fractions (8,13,16,18,19,24) are indicated. (b) Coomassie-stained SDS-gel of crude CHO cell membranes expressing Kv2.1 and specific column fractions indicated in (a). (c) Western immunoblot generated using polyclonal rabbit antibodies directed against the amino acid sequence CHMLPGGGAHGSTRDQSI in Kv2.1. Only crude membranes and fraction 16 showed signal for Kv2.1.
FIGURE 3
FIGURE 3
Gallery of raw particle images of negatively stained Kv2.1 selected from several electron micrographs. Perusal of the images and comparison with the 3D reconstruction (Fig. 5) suggest that there is a preference for the particles to lie with their long axis parallel to the plane of the carbon film of the EM grid. Scale bar, 500 Å.
FIGURE 4
FIGURE 4
Single particle image analysis. (a) Histogram displaying the classification of the individual particles from the final round of refinement. Each spot represents a particular orientation of the two Euler angles Φ and Θ, and is assigned a grayscale value based on the number of particles assigned to that orientation. White represents 0 particles, and black the maximum of 113 particles. (b) Fourier shell correlation between two maps each calculated from the full data set but with different starting maps (solid line). The correlation drops below 0.5 at ∼25 Å resolution. For comparison, the correlation between the starting maps is also shown (dashed line). Also displayed are Fourier shell correlations for the final maps created with the first (dotted line) and second (dotted-dashed line) starting models. The graph shows correlations between maps generated by splitting the data set and calculating two maps using the Euler angle assignments from the final round of refinement. The two plots are very similar, with a 0.5 correlation at ∼19 Å for both. For convenience, horizontal and vertical dotted lines have been added at the 0.5 correlation level to indicate the resolution for each of the curves. (c) Representative particles from different orientations. The left column contains examples of raw particles assigned to a given orientation. The middle column contains images generated by averaging all the raw particles in the orientation group. The images in the right column are generated by projecting the final 3D map at the indicated orientation.
FIGURE 5
FIGURE 5
Surface-shaded, 3D density map of human Kv2.1 at ∼25 Å resolution. The fourfold axis is oriented in the y direction. The maps have been aligned such that the putative cytoplasmic and TM domains are oriented at the bottom and top, respectively. (a) View with the isosurface contour set to include the expected volume for the entire tetrameric complex. (b) The same map as (a) but rotated by 45° around the fourfold axis. The white lines are spaced at 30 Å and indicate the presumed location of the lipid bilayer. (c) The same view as a but with a sagittal section removed to show an interior chamber at this isosurface level. (d and e) The same views as a and b, respectively, but with a contour set to a lower level that includes only 66% of the expected volume to visualize windows into the internal space. The white mesh represents the expected isosurface for the full protein. (f) A sagittal section at a lower (75%) isosurface level to display an additional internal chamber.
FIGURE 6
FIGURE 6
Coronal sections of density (a–f) and a sagittal section (g) through the 3D map of Kv2.1 are shown in grayscale, in which white is the highest density (corresponding to protein). The surface-shaded view of the 3D map (h) provides a key indicating the position of the slices in the map.
FIGURE 7
FIGURE 7
Fit of the x-ray crystal structure of Kv1.2 into the Kv2.1 map. The views in a and b are related by a 45° rotation about the fourfold axis. The isosurface for the Kv2.1 map has been set to include 100% of the expected protein volume. The four polypeptide chains have been given different colors. Gaps in the Kv1.2 ribbon trace result from an incomplete chain trace in the Kv1.2 pdb file (5). (c) The same view in a but only a single Kv1.2 subunit is displayed. The T1 domain and TM helices have been labeled. Also indicated are the predicted positions of residues 67 and 75, which are believed to interact with the C-terminal domains. (d) View of the fit rotated with the fourfold symmetry axis pointing toward the viewer.
FIGURE 8
FIGURE 8
Fit of KcsA into the transmembrane region of the Kv2.1 map. The isosurface has been set to 33% of the expected volume. Close-ups with transparent (a) and solid (b) Kv2.1 maps.
FIGURE 9
FIGURE 9
Kv2.1 map with the fit Kv1.2 structure. The alignment of the transmembrane domains of the Kv1.2 structure within the Kv2.1 map places the Kv1.2 T1 domain within a region of high density in the Kv2.1 map. Surrounding regions of lower density are ascribed to putative aqueous chambers. The map density has been cut away to allow visualization of the T1 domain relative to the internal spaces. The map isosurface is set at 80% so that the upper and lower chambers can be visualized. The chambers appear both above and below T1.

References

    1. Minor, D. L., Jr. 2001. Potassium channels: Life in the post-structural world. Curr. Opin. Struct. Biol. 11:408–414. - PubMed
    1. Yellen, G. 2002. The voltage-gated potassium channels and their relatives. Nature. 419:35–42. - PubMed
    1. Doyle, D. A., J. Morais Cabral, R. A. Pfuetzner, A. Kuo, J. M. Gulbis, S. L. Cohen, B. T. Chait, and R. MacKinnon. 1998. The structure of the potassium channel: Molecular basis of K+ conduction and selectivity. Science. 280:69–77. - PubMed
    1. Zhou, Y., J. H. Morais-Cabral, A. Kaufman, and R. MacKinnon. 2001. Chemistry of ion coordination and hydration revealed by a K+ channel-Fab complex at 2.0 Å resolution. Nature. 414:43–48. - PubMed
    1. Jiang, Y., A. Lee, J. Chen, V. Ruta, M. Cadene, B. T. Chait, and R. MacKinnon. 2003. X-ray structure of a voltage-dependent K+ channel. Nature. 423:33–41. - PubMed

Publication types

LinkOut - more resources