. 2008 May 1;94(9):3393-404.
doi: 10.1529/biophysj.107.112805. Epub 2008 Jan 22.

Distribution of amino acids in a lipid bilayer from computer simulations

Affiliations

Distribution of amino acids in a lipid bilayer from computer simulations

Justin L MacCallum et al. Biophys J. .

Abstract

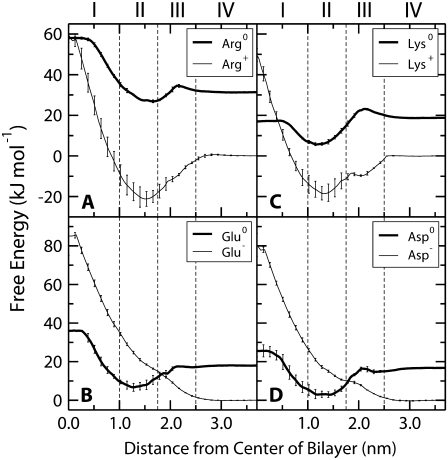
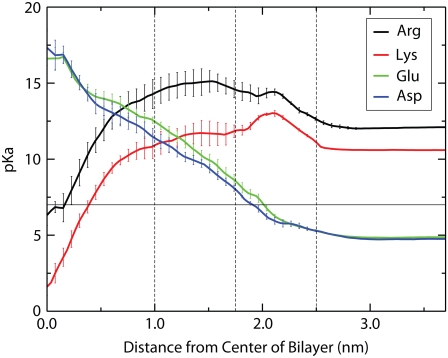
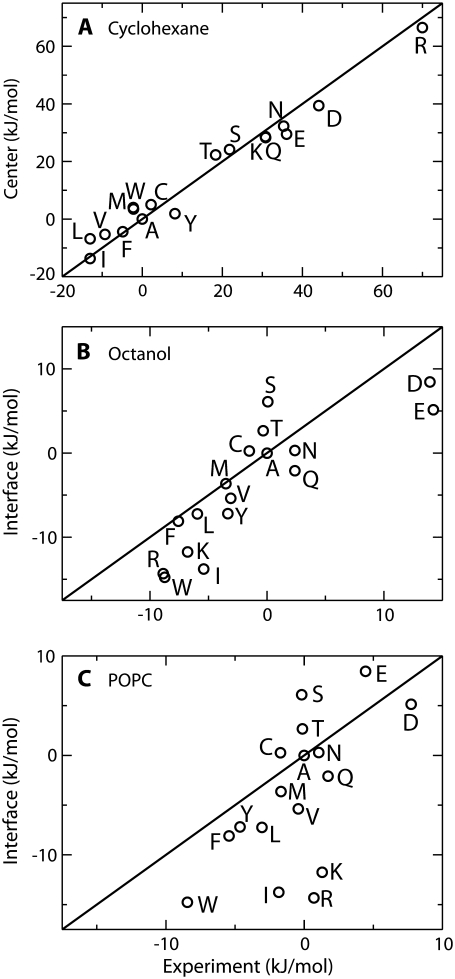
We have calculated the distribution in a lipid bilayer of small molecules mimicking 17 natural amino acids in atomistic detail by molecular dynamics simulation. We considered both charged and uncharged forms for Lys, Arg, Glu, and Asp. The results give detailed insight in the molecular basis of the preferred location and orientation of each side chain as well the preferred charge state for ionizable residues. Partitioning of charged and polar side chains is accompanied by water defects connecting the side chains to bulk water. These water defects dominate the energetic of partitioning, rather than simple partitioning between water and a hydrophobic phase. Lys, Glu, and Asp become uncharged well before reaching the center of the membrane, but Arg may be either charged or uncharged at the center of the membrane. Phe has a broad distribution in the membrane but Trp and Tyr localize strongly to the interfacial region. The distributions are useful for the development of coarse-grained and implicit membrane potentials for simulation and structure prediction. We discuss the relationship between the distribution in membranes, bulk partitioning to cyclohexane, and several amino acid hydrophobicity scales.


Figures

FIGURE 1
FIGURE 1
Snapshot and partial density profiles of the simulated system. The lines and roman numerals divide the system into four regions as described in the text. (A) Snapshot of the simulated system. The lipid nitrogen and phosphate atoms are shown as blue and orange spheres respectively. Water is shown as red (oxygen) and white (hydrogen) cylinders. The lipid tails are shown as thin gray lines. Two valine side chains are shown as cyan (carbon) and white (hydrogen) spheres. (B) Partial density profile for the system.
FIGURE 2
FIGURE 2
PMFs for uncharged amino acids: (A) aliphatic, (B) Cys and Met, (C) aromatic, (D) polar. All PMFs are set to zero in the water phase. The system is divided into the same four regions as in Fig. 1. Error bars indicate the SE based on the asymmetry between the two leaflets of the bilayer.
FIGURE 3
FIGURE 3
Orientation of aromatic residues as a function of depth in the membrane. The panels show the orientations when the aromatic residue is at the center of the membrane (top), at 0.8 nm from the center (middle), and in bulk water (bottom). The thick lines represent the distribution of θ1, which is the angle between the normal of the aromatic ring and the bilayer normal. Thin lines represent the distribution of θ2, which represents the angle between the long axis of the molecule and the bilayer normal. For Phe and Tyr, θ2 represents the angle between the vector defined by C1 and C3 of the benzene ring and the bilayer normal. For Trp, θ2 represents the angle between the vector defined by CD1 and CH2 and the bilayer normal.
FIGURE 4
FIGURE 4
Snapshots of polar and charged residues near the center of the bilayer. The system is presented using the same colors and representations as Fig. 1. (A) Asn at 0.4 nm from the center of the bilayer. A large, partially lipid-lined water defect is present. (B) Asn at 0.3 nm from the center of the bilayer. Moving the Asn 0.1 nm further from the center of the bilayer has led to the dissipation of the water defect. (C) A positively charged Arg at the center of the bilayer, with associated water defect.
FIGURE 5
FIGURE 5
PMFs for the ionizable residues: (A) Arg, (B) Lys, (C) Glu, (D) Asp. The PMFs for the ionized forms have been set to zero in the water phase. The neutral PMFs have been offset by the free energy to neutralize the residue in bulk water at pH 7.0. Error bars indicate the SE based on the asymmetry between the two leaflets of the bilayer.
FIGURE 6
FIGURE 6
Thermodynamic cycle for calculation the pKa as function of depth in the membrane. The two ΔGTransfer values are calculated by umbrella sampling and ΔGAcid→Base,Water is calculated based on the pKa as described in the text. Calculation of these three terms allows the fourth term, ΔGAcid→Base,Membrane to be determined.
FIGURE 7
FIGURE 7
Side chain pKa as a function of depth in the membrane. The pKa is calculated from the free energy difference between the acidic and basic species as described in the text. Error bars indicate the SE error based on the asymmetry between the two leaflets of the bilayer.
FIGURE 8
FIGURE 8
Comparison of calculated transfer free energies with several interfacial scales. All scales have been shifted so that the free energy for Ala is zero. Solid lines indicate perfect agreement between calculation and experiment and are not best-fit lines. (A) Comparison between calculated free energy for transferring the side chain from water to the center of the bilayer, and the experimental water to cyclohexane transfer free energy (54). (B) Relationship between the calculated water to membrane interface transfer free energy, and the experimental partitioning of Ace-WLLxL peptides between water and water saturated 1-octanol (15). (C) Comparison between the calculated transfer free energy between water and the membrane interface and the experimental partitioning of Ace-WLLxL peptides between water and a POPC bilayer (16).

References

    1. Jiang, Y. X., A. Lee, J. Y. Chen, V. Ruta, B. T. Chait, and R. MacKinnon. 2003. X-ray structure of a voltage-dependent K+ channel. Nature. 423:33–41. - PubMed
    1. Long, S. B., E. B. Campbell, and R. MacKinnon. 2005. Crystal structure of a mammalian voltage-dependent Shaker family K+ channel. Science. 309:897–903. - PubMed
    1. Jiang, Y. X., V. Ruta, J. Y. Chen, A. Lee, and R. MacKinnon. 2003. The principle of gating charge movement in a voltage-dependent K+ channel. Nature. 423:42–48. - PubMed
    1. Long, S. B., E. B. Campbell, and R. MacKinnon. 2005. Voltage sensor of kv1.2: structural basis of electromechanical coupling. Science. 309:903–908. - PubMed
    1. Dorairaj, S., and T. W. Allen. 2007. On the thermodynamic stability of a charged arginine sidechain in a transmembrane helix. Proc. Natl. Acad. Sci. USA. 104:4943–4948. - PMC - PubMed

Publication types