. 2008 Mar;28(6):1988-98.
doi: 10.1128/MCB.01442-07. Epub 2008 Jan 22.

Chromatin-bound p53 anchors activated Smads and the mSin3A corepressor to confer transforming-growth-factor-beta-mediated transcription repression

Affiliations

Chromatin-bound p53 anchors activated Smads and the mSin3A corepressor to confer transforming-growth-factor-beta-mediated transcription repression

Deepti Srinivas Wilkinson et al. Mol Cell Biol. 2008 Mar.

Abstract

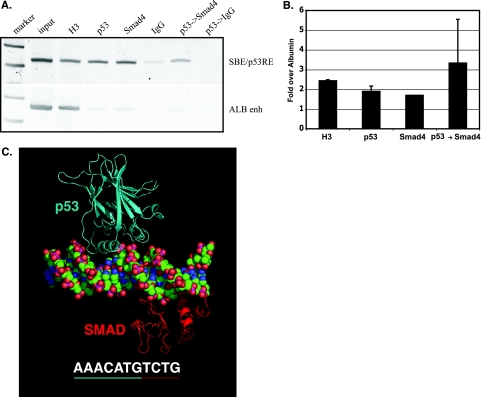
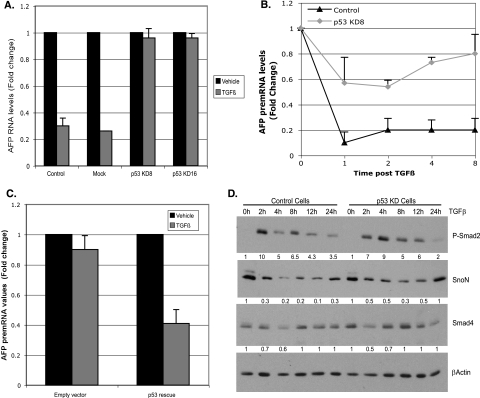
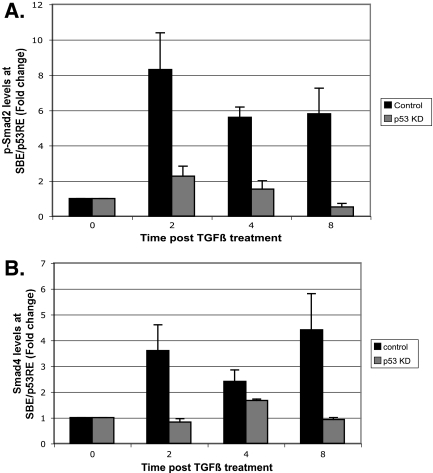
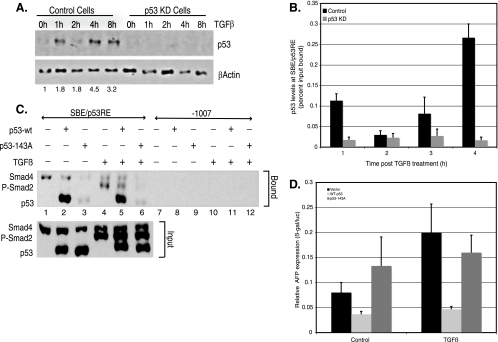
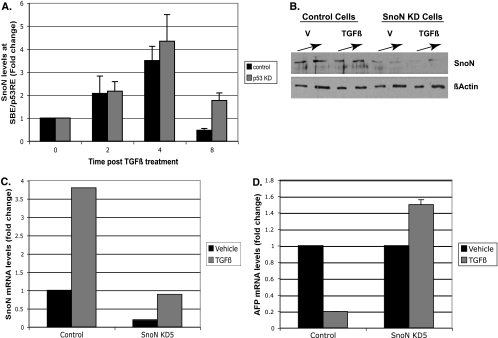
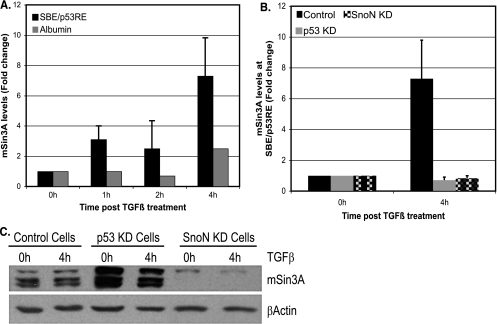
In hepatic cells, Smad and SnoN proteins converge with p53 to repress transcription of AFP, an oncodevelopmental tumor marker aberrantly reactivated in hepatoma cells. Using p53- and SnoN-depleted hepatoma cell clones, we define a mechanism for repression mediated by this novel transcriptional partnership. We find that p53 anchors activated Smads and the corepressor mSin3A to the AFP distal promoter. Sequential chromatin immunoprecipitation analyses and molecular modeling indicate that p53 and Smad proteins simultaneously occupy overlapping p53 and Smad regulatory elements to establish repression of AFP transcription. In addition to its well-known function in antagonizing transforming growth factor beta (TGF-beta) responses, we find that SnoN actively participates in AFP repression by positively regulating mSin3A protein levels. We propose that activation of TGF-beta signaling restores a dynamic interplay between p53 and TGF-beta effectors that cooperate to effectively target mSin3A to tumor marker AFP and reestablish transcription repression.


Figures

FIG. 1.
FIG. 1.
p53 and Smads simultaneously occupy an intercalated SBE/p53RE. (A and B) ChIP analysis of normal, differentiated liver tissue from mice correlates with repression of AFP expression. (A) PCR products. Input DNA (diluted 1/10) and DNA enriched by ChIP (histone H3 [diluted 1/10], immunoglobulin G [IgG] control, p53, and Smad4 antibodies) and sequential ChIP (p53→Smad4, primary antibody enrichment followed by secondary antibody enrichment) of p53, Smad4, and both p53 and Smad4 proteins bound to the AFP SBE/p53RE and negative, distal control albumin enhancer (ALB enh) regions. (B) Quantified ChIP and sequential ChIP of p53 and Smad4 interaction with chromatin, as in panel A. The graph shows changes in enrichment of indicated proteins bound at AFP SBE/p53RE compared to that of the ALB enhancer region. All values, generated by real-time PCR analysis, were normalized to control IgG precipitations and represent means plus standard deviations (error bars) of triplicate determinations. (C) Molecular model of simultaneous binding of p53 and Smad to the AFP SBE/p53RE. DNA sequence shown in its entirety is the upstream, p53 regulatory element (p53 dimer binding site) with the Smad binding sequence underlined in red, centered at −850 of AFP. The molecular model reveals no clash between p53 and the Smad3 MH1 domains even without energy minimization, indicating that the two proteins can bind the site simultaneously.
FIG. 2.
FIG. 2.
Stable depletion of p53 compromises AFP repression in response to TGF-β. (A) Quantitative RT-PCR analysis of AFP RNA. Hepa 1-6 parental cells (control), mock selected cells, and two independent p53 knockdown (KD) clones (p53 KD clone 8 [KD8] and KD16) were treated with TGF-β for 24 h and harvested for RNA analysis. AFP RNA levels in untreated cells were set at 1. All the values, normalized to actin RNA levels represent averages plus standard deviations (SD) (error bars) from three experiments. Black and gray bars indicate vehicle- and TGF-β-treated samples, respectively. p53 RNA levels were regularly monitored (data not shown) to ensure maintenance of p53 depletion. In subsequent analyses, p53 KD clone 8 was used, since these cells maintained p53 knockdown more effectively over passage of the cells (data not shown). (B) Graph showing the changes in AFP pre-mRNA levels compared to the time zero value over the indicated time course of TGF-β treatment in control and p53 KD Hepa 1-6 cells. Values represent averages plus SD (error bars) from three or four experiments. (C) Rescue of AFP repression by introduction of p53 in KD cells. AFP repression was monitored by measuring AFP pre-mRNA levels under the conditions described above for panel B. All values were normalized to actin and represent means plus SD (error bars) for triplicate determinations. (D) Stable depletion of p53 does not significantly alter the global levels of TGF-β effectors. Western blot analysis performed on nuclear extracts of control and p53 KD8 Hepa 1-6 cells for the indicated proteins over the time course of TGF-β treatment. Actin was used to control for loading and to normalize quantified protein levels. The amount of change (n-fold) in normalized protein expression is shown below the lanes in the immunoblots. The expression levels of each protein at the 0-h time point were set at 1.
FIG. 3.
FIG. 3.
p53 anchors Smads to the AFP SBE/p53RE. (A and B) Quantified ChIP analysis of phosphorylated Smad2 (p-Smad2) (A) and Smad4 (B) binding to SBE/p53RE. Control Hepa 1-6 cells and p53 KD cells were treated with TGF-β and harvested at the indicated time points for pSmad2 and Smad4 ChIP analyses. The graphs show the levels of the indicated proteins recruited to SBE/p53RE in control and p53 KD clone 8 cells over the indicated time course. All data were normalized to input measurements and represent averages plus standard deviations (error bars) of triplicate determinations. Control immunoglobulin G immunoprecipitations were performed in parallel to quantify antibody specificity (not shown).
FIG. 4.
FIG. 4.
DNA binding of p53 at the SBE/p53RE is essential for AFP repression by TGF-β. (A) Immunoblot analysis of p53 protein levels in response to TGF-β treatment in control and p53 KD cells, performed as described in the legend to Fig. 2D. (B) p53 is poised at the AFP SBE/p53RE prior to TGF-β treatment. The absolute levels of p53 bound to SBE/p53RE in control and p53 KD Hepa 1-6 cells treated with TGF-β over the indicated time course, as determined by ChIP analysis of p53, are shown. All data were normalized to input and represent averages plus standard errors of the means (error bars) from four or five experiments. (C) Interaction of Smad proteins at the SBE/p53RE depends on p53-DNA binding. The panel represents Western blot analyses for endogenous P-Smad2, Smad4, and exogenous p53. Lanes 2 and 5 show protein complexes from p53 KD Hepa 1-6 cells transfected with wild-type p53 (p53-wt), untreated (−) or treated with TGF-β (3 ng/ml) (+), were precipitated using biotinylated oligonucleotides containing the SBE/p53RE consensus. Lanes 3 and 6 show the same experimental conditions as described for lanes 2 and 5 except that the cells were transfected with a DNA binding mutant of p53 (p53-143A) (+). For a negative control, the protein complexes were precipitated using biotinylated oligonucleotides containing distal promoter elements of AFP (−1007 to −977). (D) p53 KD Hepa 1-6 hepatoma cells were transfected with the AFP/lacZ reporter construct (1 μg/plate) along with the indicated expression vectors (WT p53 or p53-143A, 50 ng/plate each). Each plate was also cotransfected with the Renilla luciferase (500 ng/plate) to standardize and control for transfection efficiency. Eight hours posttransfection, the cells were treated with TGF-β or its vehicle (control) for 24 h. Expression levels relative to baseline are indicated for AFP/lacZ (black). Relative AFP expression is shown as the ratio of β-galactosidase to luciferase expressed (β-gal/luc).
FIG. 5.
FIG. 5.
SnoN is essential for TGF-β-mediated AFP repression. (A) SnoN recruitment to SBE/p53RE is independent of p53. Quantified ChIP analysis for SnoN protein bound to SBE/p53RE was performed with a SnoN-specific antibody as described in the legend to Fig. 3. (A and B) Stable depletion of SnoN compromises AFP repression in response to TGF-β. (B) Analysis of SnoN protein levels. Control and SnoN KD Hepa 1-6 cells were treated with vehicle (V) or TGF-β and harvested for nuclear extract preparation. Standard Western blot analysis was performed to determine the levels of SnoN protein depletion. Actin levels were used to control for loading errors. (C) Quantitative RT-PCR analysis of SnoN RNA was performed as described in the legend to Fig. S1 in the supplemental material to ensure maintenance of SnoN KD under the experimental conditions shown in panel D. (D) Quantitative RT-PCR analysis of AFP RNA was performed as described in the legend to Fig. 2A for the indicated cell types. Black and gray bars indicate vehicle- and TGF-β-treated cells, respectively.
FIG. 6.
FIG. 6.
p53 recruits mSin3A to the AFP SBE/p53RE, while SnoN acts to maintain mSin3A protein levels. (A and B) ChIP analysis of mSin3A interaction with chromatin in control cells (A) and p53-SnoN KD cells (B). (A) Graph showing levels of mSin3A recruitment to AFP SBE/p53RE at the indicated times after TGF-β treatment. PCR amplifications were performed with albumin primers as a distal control of specificity. (B) Graph showing the levels of mSin3A recruited to SBE/p53RE in control cells, p53 KD cells, and SnoN KD cells 4 h after TGF-β treatment. (C) SnoN is required to maintain mSin3A protein levels in Hepa 1-6 cells. Western blot analysis for mSin3A levels in nuclear extracts prepared from control, p53 KD, and SnoN KD cells. Actin levels serve to normalize loading errors.

Similar articles

Cited by

References

    1. Appella, E., and C. W. Anderson. 2000. Signaling to p53: breaking the posttranslational modification code. Pathol. Biol. (Paris) 48227-245. - PubMed
    1. Arva, N. C., T. R. Gopen, K. E. Talbott, L. E. Campbell, A. Chicas, D. E. White, G. L. Bond, A. J. Levine, and J. Bargonetti. 2005. A chromatin-associated and transcriptionally inactive p53-Mdm2 complex occurs in mdm2 SNP309 homozygous cells. J. Biol. Chem. 28026776-26787. - PubMed
    1. Bakker, J., C. De Mees, Q. Douhard, J. Balthazart, P. Gabant, J. Szpirer, and C. Szpirer. 2006. Alpha-fetoprotein protects the developing female mouse brain from masculinization and defeminization by estrogens. Nat. Neurosci. 9220-226. - PubMed
    1. Brunger, A. T., P. D. Adams, G. M. Clore, W. L. DeLano, P. Gros, R. W. Grosse-Kunstleve, J. S. Jiang, J. Kuszewski, M. Nilges, N. S. Pannu, R. J. Read, L. M. Rice, T. Simonson, and G. L. Warren. 1998. Crystallography & NMR system: a new software suite for macromolecular structure determination. Acta Crystallogr. Sect. D 54905-921. - PubMed
    1. Cordenonsi, M., S. Dupont, S. Maretto, A. Insinga, C. Imbriano, and S. Piccolo. 2003. Links between tumor suppressors: p53 is required for TGF-beta gene responses by cooperating with Smads. Cell 113301-314. - PubMed

Publication types

MeSH terms