Comparative Study
. 2008 Apr;28(7):2221-34.
doi: 10.1128/MCB.01659-07. Epub 2008 Jan 22.

Stress-dependent dynamics of global chromatin remodeling in yeast: dual role for SWI/SNF in the heat shock stress response

Affiliations
Comparative Study

Stress-dependent dynamics of global chromatin remodeling in yeast: dual role for SWI/SNF in the heat shock stress response

Sushma Shivaswamy et al. Mol Cell Biol. 2008 Apr.

Abstract

Although chromatin structure is known to affect transcriptional activity, it is not clear how broadly patterns of changes in histone modifications and nucleosome occupancy affect the dynamic regulation of transcription in response to perturbations. The identity and role of chromatin remodelers that mediate some of these changes are also unclear. Here, we performed temporal genome-wide analyses of gene expression, nucleosome occupancy, and histone H4 acetylation during the response of yeast (Saccharomyces cerevisiae) to different stresses and report several findings. First, a large class of predominantly ribosomal protein genes, whose transcription was repressed during both heat shock and stationary phase, showed strikingly contrasting histone acetylation patterns. Second, the SWI/SNF complex was required for normal activation as well as repression of genes during heat shock, and loss of SWI/SNF delayed chromatin remodeling at the promoters of activated genes. Third, Snf2 was recruited to ribosomal protein genes and Hsf1 target genes, and its occupancy of this large set of genes was altered during heat shock. Our results suggest a broad and direct dual role for SWI/SNF in chromatin remodeling, during heat shock activation as well as repression, at promoters and coding regions.


Figures
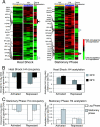
FIG. 1.
FIG. 1.
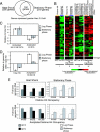
Gene expression levels correlate positively with histone H4 acetylation and negatively with histone H4 occupancy. (A) Comparison of gene expression changes with change in histone H4 occupancy and acetylation levels at promoters after heat shock and stationary-phase stress. In the two left panels of the heat map (H4 occupancy and acetylation), each column represents an immunoprecipitation performed from an independent cross-linking experiment. The gene expression column represents the median expression change calculated from three independent biological replicates. ChIP-chip data were filtered for consistent changes (positive or negative log2 ratio) in occupancy and acetylation across the three biological replicates and clustered hierarchically along with the gene expression data. The black and gray arrows indicate the most strongly upregulated and downregulated genes, respectively. (B and C) Average histone H4 occupancy and acetylation levels at the promoters of genes activated and repressed more than 2.5-fold after heat shock and stationary-phase stress, respectively. (B) The bars represent the average H4 occupancy and acetylation at the promoters of 248 activated and 295 repressed heat shock genes at the indicated temperatures. (C) The white bars represent the average H4 occupancy and acetylation at the promoters of 280 activated and 219 repressed stationary-phase genes at the indicated phases of growth. The y axes show the average change in the occupancy or acetylation measured as the log2 ratio. Error bars represent the standard error of the mean.
FIG. 2.
FIG. 2.
Genes repressed after both heat shock and stationary-phase stress show inverse histone H4 acetylation levels. (A) Venn diagram indicating the total number of genes repressed more than 2.5-fold after heat shock and stationary-phase stress and the number of genes common to both sets. (B) Change in histone H4 occupancy and acetylation at the promoters of the 152 genes repressed after both heat shock and stationary-phase stress. Panels i and ii show the change in H4 occupancy and acetylation after stress, whereas panels iii and iv show the change in acetylated histone H4 occupancy before and after stress, normalized to the underlying nucleosome occupancy. The average H4 occupancy and acetylation levels from the heat map are shown at the bottom. Heat shock is accompanied by a decrease in histone H4 acetylation at the promoters of the 152 genes, whereas stationary-phase stress is accompanied by an increase in H4 acetylation at the same promoters. The heat map was gen-erated after hierarchical clustering. (C) Average H4 acetylation levels at K5, 8, 12, and 16 and acetylation levels specifically at H4 K16 during log and stationary phases at the promoters of genes repressed after both heat shock and stationary-phase stress. The high levels of acetylation seen at the H4 N-terminal tail are not due to H4 K16 acetylation. (D) H3 acetylation at the promoters of the 152 repressed genes during stationary-phase stress. There was an increase in total H3 occupancy at these promoters but a strong reduction in H3 K9/18 acetylation upon stationary-phase stress. Total H3 occupancy was measured relative to genomic DNA and the acetyl-H3 K9/18 occupancy was normalized to total H3 occupancy. (E) q-PCR verification of the change in histone H4 occupancy and acetylation at the promoters of 3 of the 152 repressed genes chosen at random. Error bars represent the standard deviation across three replicates.
FIG. 3.
FIG. 3.
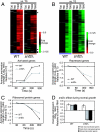
Time course gene expression profiles of heat shock-activated and -repressed genes in WT and snf2Δ cells. mRNAs were harvested before heat shock (T0) and at T30, T60, T300, and T900 after heat shock. The expression levels of all the genes from the different time points in WT and snf2Δ cells were normalized to the expression levels in the respective T0 samples. (A) The expression profiles of heat shock-activated genes were clustered hierarchically and are displayed using a red-green heat map. There were 22 genes that were not upregulated in snf2Δ cells even after 15 min of heat shock and are indicated with black bars on the right. The graph below shows the average expression levels of all the activated genes at each of the time points. (B) The expression profiles of heat shock-repressed genes are displayed on top, and a graph showing the average expression levels at each of the time points for these genes is plotted below. Error bars represent the standard error of the mean. (C) Average expression levels of the RP genes at different time points after heat shock in WT and snf2Δ cells. Error bars represent the standard errors of the means. (D) Deletion of SNF2 does not affect the basal level expression of heat shock-activated genes during normal growth conditions. However, there was a 1.4-fold decrease in the expression of heat shock-repressed genes and RP genes for snf2Δ cells compared to what was seen for WT cells during normal growth at 30°C.
FIG. 4.
FIG. 4.
Kinetics of the change in histone H4 occupancy at the promoters and coding regions of heat shock-activated and -repressed genes. WT and snf2Δ cells were subjected to heat shock and cells were cross-linked at T5, T15, T30, T60, T300, and T900 after temperature shift. Histone occupancies at all time points in both strains were normalized to the occupancy in WT cells at time point T0. Data represent the average of three biological replicates and the error bars represent the standard errors of the means. (A) Kinetics of histone depletion from the promoters and coding regions (ORFs) of activated genes. (B) Kinetics of increase in histone occupancy at the promoters and coding regions of heat shock-repressed genes.
FIG. 5.
FIG. 5.
Snf2 is recruited to RP genes under normal (unstressed) growth conditions and to Hsf1 target genes upon heat shock. Cy5-labeled Snf2 ChIP DNA was hybridized onto microarrays along with Cy3-labeled input DNA. The distributions of log2 ratios for heat shock-activated gene promoters and coding regions (A), Hsf1 target gene promoters (16) and coding regions (B), and RP gene promoters and coding regions (C) are shown. The distributions of the log2 ratios for the remainder of the genes on the array (other genes) are also plotted in each of the graphs.
FIG. 6.
FIG. 6.
Quantitative real-time verification of Snf2 ChIP-chip data. Five genes (GLK1, HSP82, KAR2, SSA1, DDR2, and SPL2) that showed an increase in Snf2 occupancy after heat shock and three control genes (FLO5, MDM20, and MCM10) that did not show an increase after heat shock in the microarray experiments were selected. Primers were designed to amplify 60 to 80 bp of their promoters, and qRT-PCR was carried out. Error bars show the standard deviations from three replicate reactions.
FIG. 7.
FIG. 7.
Model for chromatin changes during transcriptional activation and repression after heat shock stress. (A) An activation model for a prototypical heat shock gene. Upon heat shock, Hsf1 bound to the promoter-proximal heat shock element recruits the SWI/SNF complex to the promoter. SWI/SNF displaces nucleosomes in the promoter, exposing the TATA box and making the promoter more accessible for TFIID binding (23). Once TFIID binds, it recruits the holo-RNA Pol II complex and facilitates active preinitiation complex assembly. This leads to activated transcription of the heat shock genes at 39°C. Although not shown in the model, it is possible that Hsf1 recruits a HAT (39) and its action precedes the recruitment of SWI/SNF. (B) Repression model for RP genes. RP genes are actively transcribed at 30°C, and Snf2 recruitment to their coding regions facilitates transcription elongation. Rap1 binds to the promoters of RP genes and directly or indirectly (via cofactors) recruits Esa1 (39). Rap1 also recruits Fhl1 and Ifh1 to the RP genes, and their binding leads to preinitiation complex assembly (41, 42, 54, 62). Upon heat shock, Rap1 recruits presently unknown repressors to the promoter of the RP genes. These repressors downregulate transcription in a SWI/SNF-dependent manner, probably by bringing about nucleosome reassembly at the promoter and the coding region.

Similar articles

Cited by

References

    1. Abrams, E., L. Neigeborn, and M. Carlson. 1986. Molecular analysis of SNF2 and SNF5, genes required for expression of glucose-repressible genes in Saccharomyces cerevisiae. Mol. Cell. Biol. 63643-3651. - PMC - PubMed
    1. Bernstein, B. E., C. L. Liu, E. L. Humphrey, E. O. Perlstein, and S. L. Schreiber. 2004. Global nucleosome occupancy in yeast. Genome Biol. 5R62. - PMC - PubMed
    1. Boy-Marcotte, E., G. Lagniel, M. Perrot, F. Bussereau, A. Boudsocq, M. Jacquet, and J. Labarre. 1999. The heat shock response in yeast: differential regulations and contributions of the Msn2p/Msn4p and Hsf1p regulons. Mol. Microbiol. 33274-283. - PubMed
    1. Corey, L. L., C. S. Weirich, I. J. Benjamin, and R. E. Kingston. 2003. Localized recruitment of a chromatin-remodeling activity by an activator in vivo drives transcriptional elongation. Genes Dev. 171392-1401. - PMC - PubMed
    1. Deckert, J., and K. Struhl. 2001. Histone acetylation at promoters is differentially affected by specific activators and repressors. Mol. Cell. Biol. 212726-2735. - PMC - PubMed

Publication types

MeSH terms

Associated data