. 2008 Apr;76(4):1476-84.
doi: 10.1128/IAI.01286-07. Epub 2008 Jan 22.

Attenuated endocytosis and toxicity of a mutant cholera toxin with decreased ability to cluster ganglioside GM1 molecules

Affiliations

Attenuated endocytosis and toxicity of a mutant cholera toxin with decreased ability to cluster ganglioside GM1 molecules

Anne A Wolf et al. Infect Immun. 2008 Apr.

Abstract

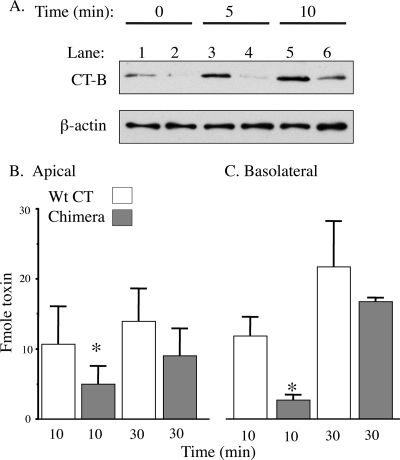
Cholera toxin (CT) moves from the plasma membrane (PM) of host cells to the endoplasmic reticulum (ER) by binding to the lipid raft ganglioside GM(1). The homopentomeric B-subunit of the toxin can bind up to five GM(1) molecules at once. Here, we examined the role of polyvalent binding of GM(1) in CT action by producing chimeric CTs that had B-subunits with only one or two normal binding pockets for GM(1). The chimeric toxins had attenuated affinity for binding to host cell PM, as expected. Nevertheless, like wild-type (wt) CT, the CT chimeras induced toxicity, fractionated with detergent-resistant membranes extracted from toxin-treated cells, displayed restricted diffusion in the plane of the PM in intact cells, and remained bound to GM(1) when they were immunoprecipitated. Thus, binding normally to two or perhaps only one GM(1) molecule is sufficient for association with lipid rafts in the PM and toxin action. The chimeric toxins, however, were much less potent than wt toxin, and they entered the cell by endocytosis more slowly, suggesting that clustering of GM(1) molecules by the B-subunit enhances the efficiency of toxin uptake and perhaps also trafficking to the ER.


Figures

FIG. 1.
FIG. 1.
Production of the mutant holotoxin containing chimeric B-subunit pentamers with CTB-W88K/G33D. (A) Schematic diagram showing B-subunit monomers (column 1) for wt CT B-subunit (row A), CTB-G33D (row B), and CTB-W88K (row C), the corresponding B-subunit homopentamers (column 2), and examples of mixed chimeric pentamers (column 3). Pentameric B-subunits are represented by five interlocking circular monomers. Amino acids G33 and W88, located in the N- and C-terminal regions of the wt CT B-subunit polypeptide, are indicated filled triangles and filled circles, respectively. The single amino acid substitutions G33D and W88K are indicated by open triangles and open circles, respectively. G33 and W88 contribute to the formation of wt binding sites for GM1 between adjacent monomers; wt sites are indicated by the presence of both filled triangles and filled circles in the binding pockets between neighboring monomers. The wt CT B-subunit has five binding sites for GM1 (column 2, row A), while the mutant homopentamers CTB-G33D and CTB-W88K, containing five identically substituted B-subunits, have none (column 2, rows B and C). When the CTB-W88K and CTB-G33D plasmids are coexpressed, the resultant pentameric B-subunits can be mutant homopentamers with no binding sites for GM1 (column 2, rows B and C) or chimeric pentamers with either one or two binding sites for GM1 (column 3, rows B and C), depending on the ratio of the individual monomers incorporated into the pentamer. Small arrows indicate binding sites for GM1 in chimeric pentamers. (B) Mutant B-subunits, including CTB-W88K/G33D, CTB-W88K, CTB-G33D, and CT-H57A (lanes 2 to 5), assembled with the A-subunit as efficiently as wt CT B-subunit (lane 1) to form holotoxin. Toxins were immunoprecipitated by antibodies to the B-subunit, run on SDS-PAGE gels, and immunoblotted using antibodies against the CT A- and B-subunits. (C) wt and mutant toxins or B-subunit pentamers evaluated by SDS-PAGE under nonreducing conditions and without boiling of the samples. Lane 2, wt CT B-subunit; lane 3, wt CT; lane 4, CTB-W88K; lane 5, CT W88K/G33D; lane 6, CTB-G33D. Under these conditions, B-subunit pentamers do not dissociate. Lane 1 contained molecular mass markers (from the top to the bottom, 66, 45.5, 36, 29, and 24 kDa). Under these conditions the CT A-subunit disassociated from the B-subunit and ran at approximately 30 kDa. The B-subunit remained as a pentamer and migrated based on the molecular weight, as well as the charge. As indicated by the large arrows, CTB-W88K (lane 4) migrated similar to wt CT B-subunit (lanes 2 and 3), while CTB-G33D (lane 6) migrated much higher in the gel. The mixture of CT W88K/G33D toxins contained at least four structurally distinct pentamers: CTB-W88K, a small amount of CTB-G33D, and two additional pentamer forms (indicated by the small arrows) comprising combinations of CTB-G33D and CTB-W88K. The stoichiometry of the monomers making up each pentamer could not be determined by the method used.
FIG. 2.
FIG. 2.
Chimeric CT W88K/G33D toxin induces an attenuated chloride secretory response in T84 cells. (A) Representative time course of apical toxin-induced chloride secretion in response to treatment with 10 nM wt CT (▪) or CT W88K/G33D (•) or with CTB-W88K and CTB-G33D (▵ and ○, respectively). As indicated by the arrow, the cAMP agonist vasoactive intestinal peptide (VIP) was added at the end of the time course to control monolayers to demonstrate equivalency of the secretory response and monolayer viability. The error bars indicate the variance calculated as the standard deviation (n = 2). The data are representative of the results of eight experiments. (B) Representative time course of basolateral toxin-induced chloride secretion in response to treatment with 10 nM wt CT (▪) or CT W88K/G33D (•) or in untreated controls (□). The symbols indicate the averages for two monolayers; the error bars indicate the variance calculated as the standard deviation (n = 2). The data are representative of the results of two experiments. (C) Bar graph summarizing data from multiple independent experiments, showing the maximal (Max) Isc induced by wt CT (column 2) (n = 15), 10 nM CT W88K/G33D alone (column 3) (n = 14) or with 1 μM wt CT B-subunit as a competitive blocker (column 4) (n = 6), concentrations of CT W88K/G33D ranging from 100 to 1,000 nM (columns 5 to 7) (n = 4 to 6), and CTB-W88K and CTB-G33D at a concentration of 10 nM (columns 8 and 10, respectively) (n = 8) or 300 nM (columns 9 and 11, respectively) (n = 4). The error bars indicate standard errors. The P value is ≤0.05 for comparisons of columns 3 and 2 (asterisk) and columns 4 and 3 (plus sign). (D) Time course demonstrating that Cl secretion induced by 10 nM CT (▪) can be inhibited by preincubation with 1 μM CT B-subunit (▴) but not by CTB-W88K (▵) or CTB-G33D (○). Control monolayers were included (□). The data are representative of the results of two experiments. (E) Time course demonstrating that Cl secretion induced by 10 nM CT W88K/G33D (•) is not inhibited by preincubation with CTB-W88K (▵) or CTB-G33D (○). Control monolayers were included (□). In panels D and E the data are representative of the results of two experiments. The symbols indicate the means for two monolayers; the error bars indicate the variance calculated as the standard deviation (n = 2). μA, microamperes.
FIG. 3.
FIG. 3.
Chimeric CT W88K/G33D toxins display unique biology as assessed by binding of GM1 and induction of toxicity. (A) Representative steady-state binding of wt CT B-subunit (▪) and CT W88K/G33D (•) to the cell surface membranes of T84 cells at 4°C as determined by a modified enzyme-linked immunosorbent assay. The optical density (OD) was a direct measure of the amount of the bound toxin in this assay system. The data are the means ± standard deviations for three monolayers and are representative of the results of three independent experiments. (B) Representative curve showing binding of 3 nM HRP-labeled CT B-subunit competing with different concentrations of wt CT B-subunit (▪) or CT W88K/G33D (•) on the surface of T84 cells at 4°C. The data are the means ± standard deviations for three monolayers. For some concentrations the standard deviation is obscured by the symbol. The data are representative of the results of two independent experiments. (C) Immunoprecipitation of toxin B-subunits and coimmunoprecipitation of GM1 from extracts of T84 cells preincubated with toxins at 4°C and washed before extraction. The left and right lanes contained purified GM1 (5 ng) and CT (10 ng), respectively, as controls. The other lanes (from left to right) contained extracts from cells preincubated with wt holotoxin (CT), CT G33D/W88K (chimera), or a homopentameric mutant (CTB-W88K, CTB-G33D, or CT-H57A). Toxin B-subunits were detected by immunoblotting (lower panel), and GM1 was detected using HRP-labeled CT B-subunit as a ligand blot (upper panel). The data are representative of the results of two independent experiments. (D) Representative toxin-induced chloride secretory response to 10 nM CT-H57A (▪), CT W88K/G33D (•), CTB-W88K (▵), or CTB-G33D (□) (CTB-W88K and CTB-G33D data are superimposed). The data are representative of the results of three experiments. The error bars indicate the variance calculated as the standard deviation (n = 2). μA, microamperes.
FIG. 4.
FIG. 4.
Both wt CT and the CT W88K/G33D chimeric toxins associate with DRMs and display low lateral mobility in PM consistent with localization to lipid raft microdomains. (A) Immunoblots for wt CT B-subunit (upper panel), CT W88K/G33D chimera (middle panel), and CTB-W88K (lower panel), showing association of toxins with DRM or soluble (Sol) fractions isolated from T84 cells preincubated with the indicated toxins at 4°C. The data are representative of the results of two independent experiments. (B) Representative FRAP curves for wt CT and mutant CT W88K/G33D FRAP measurements in COS-7 cells. COS-7 cells were incubated with Cy3-CT B-subunit (Wt CT) or Cy3-chimera (Chimera) and subjected to confocal FRAP using a 4-mm-diameter circular bleach region at time zero. Fluorescence recovery in the bleach region was recorded over time and normalized to the prebleach intensity. The data are representative of the results of five experiments and are the means ± standard errors for FRAP measurements for 7 to 10 individual cells.
FIG. 5.
FIG. 5.
CT W88K/G33D is endocytosed less efficiently that wt CT. (A) Immunoblots of extracts from cells allowed to endocytose toxins. T84 monolayers were treated with 10 nM wt CT (lanes 1, 3, and 5) or CT W88K/G33D (lanes 2, 4, and 6) at 4°C for 1 h and then incubated with the same toxin at 37°C for 0 (control for surface binding), 5, or 10 min, as indicated. Cells were then cooled to 4°C, washed, and acid stripped. Toxins were immunoprecipitated from total cell lysates as described in Materials and Methods. The upper panel shows the mass of toxin internalized by endocytosis as measured by SDS-PAGE and immunoblotting using antibodies against the B-subunit monomer. The lower panel is a blot of the same cell extracts for β-actin as a loading control. Comparisons of lane 3 with lane 4 and of lane 5 with lane 6 showed that more wt CT than CT W88K/G33D was endocytosed at 5 and 10 min. Typically, between 3 and 8% of apical membrane-bound wt toxin is internalized by 10 min at 37°C (26). (B and C) Bar graphs summarizing receptor-mediated endocytosis of 20 nM 125I-labeled CT (open bars) and 125I-labeled chimeric CT W88K/G33D (shaded bars) at 10 and 30 min from either the apical (B) or basolateral (C) surface of polarized intestinal T84 cells. Significantly more wt CT than chimeric CT was endocytosed from both the apical and basolateral cell surfaces at 10 min. The bars indicate the means, and the error bars indicate the standard errors (n = 5 for the apical surface; n = 2 to 5 for the basolateral surface). Asterisk, P ≤ 0.05 for a comparison of early and late time points.

References

    1. Adams, C. L., Y. T. Chen, S. J. Smith, and W. J. Nelson. 1998. Mechanisms of epithelial cell-cell adhesion and cell compaction revealed by high-resolution tracking of E-cadherin-green fluorescent protein. J. Cell Biol. 1421105-1119. - PMC - PubMed
    1. Anderson, R. G., and K. Jacobson. 2002. A role for lipid shells in targeting proteins to caveolae, rafts, and other lipid domains. Science 2961821-1825. - PubMed
    1. Bacia, K., P. Schwille, and T. Kurzchalia. 2005. Sterol structure determines the separation of phases and the curvature of the liquid-ordered phase in model membranes. Proc. Natl. Acad. Sci. USA 1023272-3277. - PMC - PubMed
    1. Brown, D. A., and E. London. 2000. Structure and function of sphingolipid- and cholesterol-rich membrane rafts. J. Biol. Chem. 27517221-17224. - PubMed
    1. Cherukuri, A., T. Shoham, H. W. Sohn, S. Levy, S. Brooks, R. Carter, and S. K. Pierce. 2004. The tetraspanin CD81 is necessary for partitioning of coligated CD19/CD21-B cell antigen receptor complexes into signaling-active lipid rafts. J. Immunol. 172370-380. - PubMed

Publication types