. 2008 Jan 29;105(4):1333-8.
doi: 10.1073/pnas.0711496105. Epub 2008 Jan 22.

Role of GSK3 beta in behavioral abnormalities induced by serotonin deficiency

Affiliations

Role of GSK3 beta in behavioral abnormalities induced by serotonin deficiency

Jean-Martin Beaulieu et al. Proc Natl Acad Sci U S A. .

Abstract

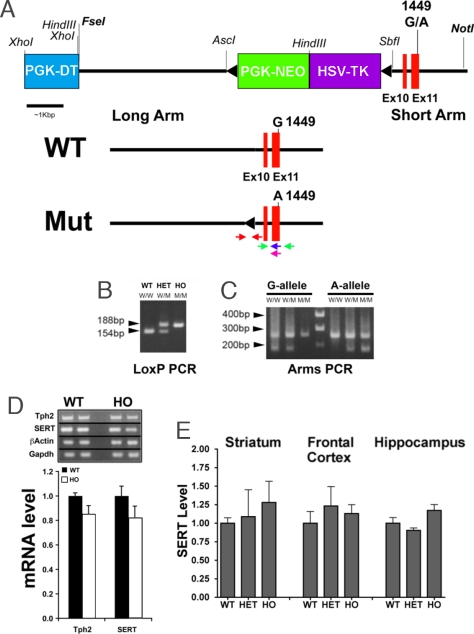
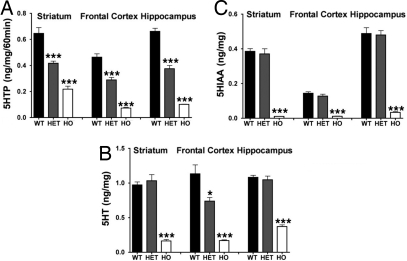
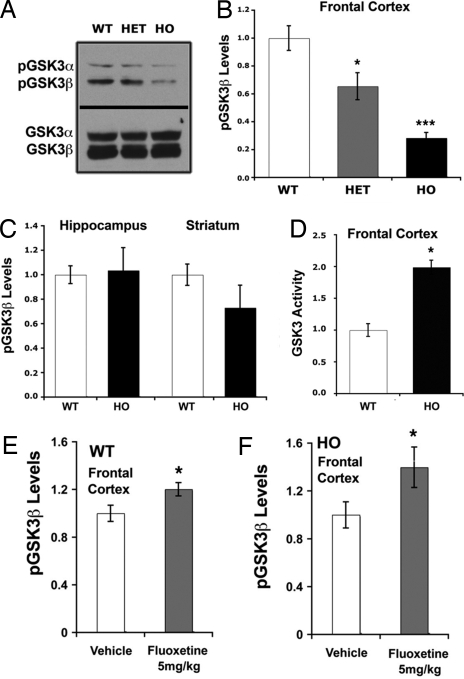
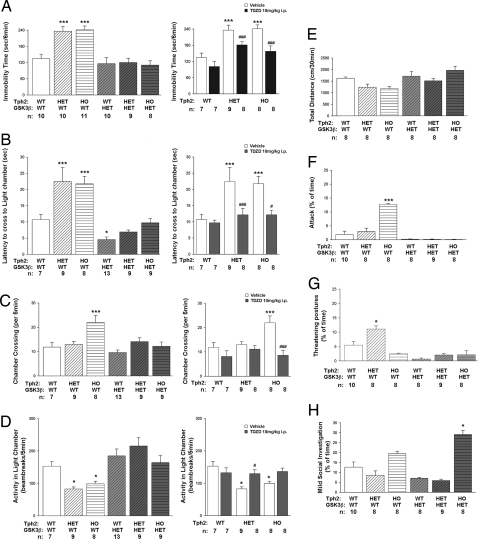
Dysregulation of brain serotonin (5-HT) neurotransmission is thought to underlie mental conditions as diverse as depression, anxiety disorders, bipolar disorder, autism, and schizophrenia. Despite treatment of these conditions with serotonergic drugs, the molecular mechanisms by which 5-HT is involved in the regulation of aberrant emotional behaviors are poorly understood. Here, we generated knockin mice expressing a mutant form of the brain 5-HT synthesis enzyme, tryptophan hydroxylase 2 (Tph2). This mutant is equivalent to a rare human variant (R441H) identified in few individuals with unipolar major depression. Expression of mutant Tph2 in mice results in markedly reduced ( approximately 80%) brain 5-HT production and leads to behavioral abnormalities in tests assessing 5-HT-mediated emotional states. This reduction in brain 5-HT levels is accompanied by activation of glycogen synthase kinase 3beta (GSK3beta), a signaling molecule modulated by many psychiatric therapeutic agents. Importantly, inactivation of GSK3beta in Tph2 knockin mice, using pharmacological or genetic approaches, alleviates the aberrant behaviors produced by 5-HT deficiency. These findings establish a critical role of Tph2 in the maintenance of brain serotonin homeostasis and identify GSK3beta signaling as an important pathway through which brain 5-HT deficiency induces abnormal behaviors. Targeting GSK3beta and related signaling events may afford therapeutic advantages for the management of certain 5-HT-related psychiatric conditions.


Conflict of interest statement

The authors declare no conflict of interest.

Figures

Fig. 1.
Fig. 1.
Generation of mice expressing the R439H allele of Tph2. (A) Diagram of the Tph2 locus and the targeting vector. The floxed PGK-NEO/HSV-TK cassette, flanked by the PGK-DT cassette and targeting arms, is illustrated. The G1449A coding mutation was engineered in exon 11 of the mouse Tph2 gene. After homologous recombination, ES cell clones carrying the mutated exon 11 were selected using ARMS-PCR and transfected with a CRE recombinase expression vector to remove the PGK-NEO/HSV-TK cassette resulting in a Tph2 mutant allele carrying a mutated exon 11 and a residual LoxP site in intron 9. The WT and mutant (Mut) alleles are shown; the location of PCR primers is indicated, red arrows: LoxP primers, green arrows: ARMS-PCR external primers, blue or purple arrows: ARMS-PCR allele-specific primers. (B and C) PCR genotyping of R439H Tph2 knockin mice. Two genotyping protocols were used, one detected the residual loxP element in intron 9 (B) and the other detected the G1449A mutation in exon 11 (C). W, G-allele; M, A-allele; the molecular weight product sizes for the G- and A-alleles are noted. WT, wild type; HET, heterozygote; HO, homozygous mutant. (D) Semiquantitative RT-PCR of Tph2 and SERT normalized to β-actin, and GADPH mRNA levels in the brainstem of WT and HO R439H Tph2 mice (n = 4 mice per group). (E) Densitometric Western blot analyses of SERT expression in different brain areas of WT, HET, and HO Tph2 knockin mice. Data are normalized to optical densities for WT animals, β-actin was used as a loading control (n = 4 mice per group). Data are means ± SEM.
Fig. 2.
Fig. 2.
Neurochemical measurements of 5-HT synthesis rates and contents in R439H Tph2 knockin mice. (A) 5-HTP synthesis rates in striatum [ANOVA, FGenotype(2,21) = 5.412, P < 0.012], frontal cortex [ANOVA, FGenotype(2,21) = 11.791, P < 0.003], and hippocampus [ANOVA, FGenotype(2,21) = 17.426, P < 0.001] from WT, HET and HO Tph2 mice. (B) 5-HT tissue contents in striatum [ANOVA, FGenotype(2,21) = 19.236, P < 0.001], frontal cortex [ANOVA, FGenotype(2,21) = 17.675, P < 0.001], and hippocampus [ANOVA, FGenotype(2,21) = 15.319, P < 0.001]. (C) 5-HIAA tissue contents in striatum [ANOVA, FGenotype(2,21) = 9.678, P < 0.001], frontal cortex [ANOVA, FGenotype(2,21) = 6.238, P < 0.007], and hippocampus [ANOVA, FGenotype(2,21) = 8.112, P < 0.002] of WT, HET and HO Tph2 mice (n = 4–11 mice per group). Data are means ± SEM. Bonferroni corrected pair-wise comparisons: *, P ≤ 0.05; ***, P ≤ 0.005 from the WT control.
Fig. 3.
Fig. 3.
Regulation of cortical GSK3β activity and levels by 5-HT and fluoxetine. (A–C) Western blot (A) and densitometric analyses (B and C) of phospho-GSK3β (Ser-9) in the frontal cortex (A and B) and hippocampus and striatum (C) of WT and HO R439H Tph2 mice (n = 5 mice per group). Densitometic data were normalized to the average optical density in WT mice, and total GSK3 levels in extracts were used as loading controls for measurement of phospho-protein levels [ANOVA frontal cortex, FGenotype (2,12) = 9.951, P < 0.003]. (D) Kinase activity assays performed after immunoprecipitation of GSK3 from protein extracts prepared from the frontal cortex of WT and HO R439H Tph2 mice [t test, t (1,8) = 4.883, P < 0.006]. Kinase assays were performed using recombinant inhibitor 2 as a substrate and kinase activity in the assay was sensitive to the GSK3 inhibitor kenpaullone (11). (E and F) Phospho-GSK3β levels in the frontal cortex of WT (E) [t test, t (1,8) = 2.768, P < 0.012] and HO R439H Tph2 knockin mice (F) [t test, t (1,8) = 2.639, P < 0.029] (n = 5 mice per group) 30 min after administration of vehicle or 5 mg/kg fluoxetine (s.c.). Data are normalized to the average signal obtained from vehicle-treated mice. Data are means ± SEM. *, P ≤ 0.05; ***, P ≤ 0.005 from the WT or vehicle control; one-way ANOVA with Bonferroni corrected pair-wise comparisons or t test.
Fig. 4.
Fig. 4.
Reduction of GSK3β activity antagonizes behavioral changes in R439H Tph2 mice. (A) Immobility times in tail suspension for vehicle-treated mice from the six genotypes (Left) and for Tph2 knockin mice treated with 10 mg/kg TDZD-8 (i.p.) the GSK3β inhibitor (Right). Data are presented as total immobility time for the 5-min test. [ANOVA, FGenotype(5,52) = 11.481, P < 0.001; TDZD ANOVA, FGenotype(2,41) = 21.775, P < 0.001; FDrug = ns; FGenotypexDrug(2,41) = 11.196, P < 0.001]. (B–D) Dark–light emergence test evaluating latency to the first cross to the lighted chamber [ANOVA, FGenotype(5,49) = 13.564, P < 0.001; TDZD ANOVA, FGenotype(2.41) = 4.595, P < 0.016; FDrug(1.41) = 10.986, P < 0.002; FGenotypexDrug(2,41) = 3.601, P < 0.036] (B), number of crosses to lighted chamber [ANOVA, FGenotype(5,49) = 6.301, P < 0.001; TDZD ANOVA, FGenotype(2.41) = 3.477, P < 0.040; FDrug(1.41) = 14.920, P < 0.001; FGenotypexDrug(2.41) = 4.980, P < 0.012] (C), and locomotor activity in the lighted chamber [ANOVA, FGenotype(5,49) = 6.493, P < 0.001; TDZD ANOVA, FGenotype(2.41) = 5.456, P < 0.008; FDrug(1.41) = 3.982, P < 0.049; FGenotypexDrug(2,41) = 4.794, P < 0.013] (D) in vehicle-treated mice from the six genotypes (Left) and for Tph2 knockin mice treated with 10 mg/kg TDZD-8 (i.p.) (Right). (E) Basal locomotor activities in vehicle-treated mice from the six genotypes. Mice were placed into the open field, and the distance traveled was monitored over 30 min. (F–H) Parameters of social interaction in the dyadic test. (F) Attacks [ANOVA, FGenotype(5,45) = 8.101 P < 0.001]. (G) Threatening postures [ANOVA, FGenotype(5,45) = 2.875 P < 0.025]. (H) Mild exploratory behaviors [ANOVA, FGenotype(5,45) = 24.722 P < 0.001]. For all behavioral tests, balanced groups of male and female mice were used, with the exception of the social interaction test, where only males where used. Data are shown as means ± SEM. *, P < 0.05; ***, P < 0.005, as compared with WT mice; #, P < 0.05; ###, P < 0.005, as compared with vehicle-treated mice from the same genotype, ANOVA with Bonferoni corrected pair-wise comparisons. Numbers of animals for each condition (n) are indicated.

Comment in

References

    1. Bonasera SJ, Tecott LH. Mouse models of serotonin receptor function: toward a genetic dissection of serotonin systems. Pharmacol Ther. 2000;88:133–142. - PubMed
    1. Gingrich JA, Hen R. Dissecting the role of the serotonin system in neuropsychiatric disorders using knockout mice. Psychopharmacology (Berlin) 2001;155:1–10. - PubMed
    1. Barnes NM, Sharp T. A review of central 5-HT receptors and their function. Neuropharmacology. 1999;38:1083–1152. - PubMed
    1. Berton O, Nestler EJ. New approaches to antidepressant drug discovery: beyond monoamines. Nat Rev Neurosci. 2006;7:137–151. - PubMed
    1. Beaulieu JM. Not only lithium: regulation of glycogen synthase kinase-3 by antipsychotics and serotonergic drugs. Int J Neuropsychopharmacol. 2007;10:3–6. - PubMed

Publication types

MeSH terms