

The genetic architecture of fasting plasma triglyceride response to fenofibrate treatment
- PMID: 18212815
- PMCID: PMC2546577
- DOI: 10.1038/sj.ejhg.5202003
The genetic architecture of fasting plasma triglyceride response to fenofibrate treatment
Abstract
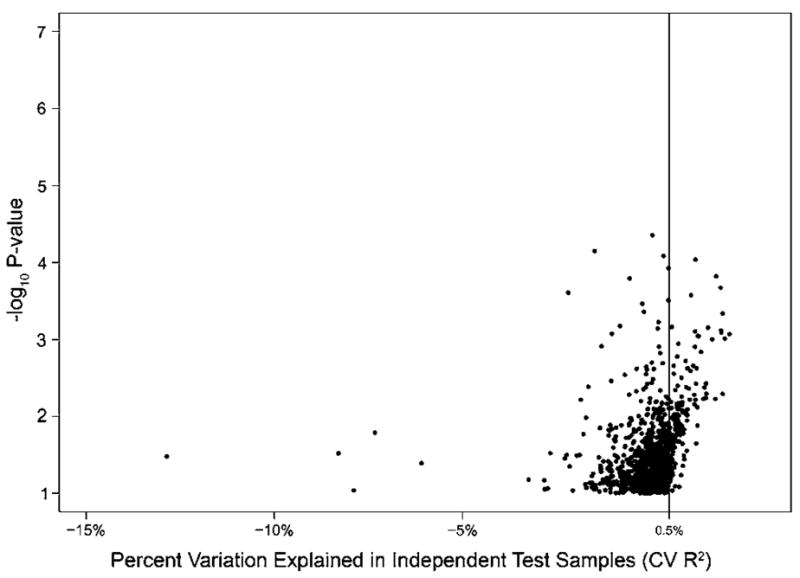
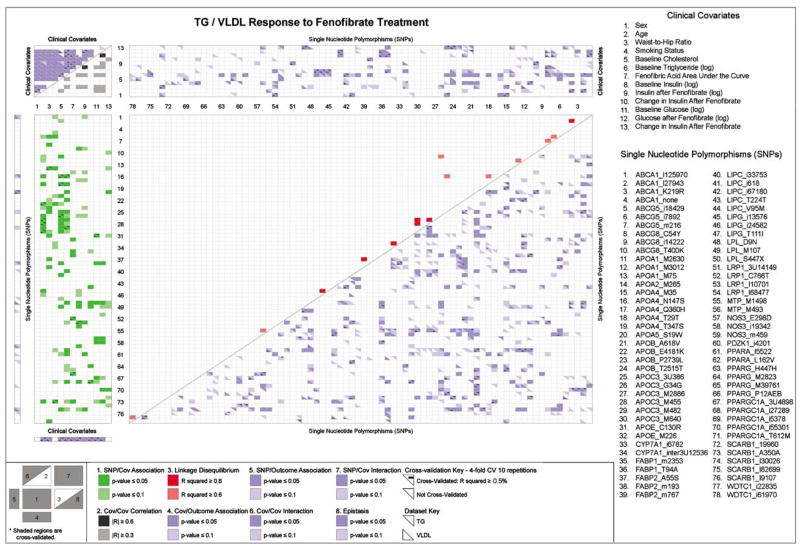
Metabolic response to the triglyceride (TG)-lowering drug, fenofibrate, is shaped by interactions between genetic and environmental factors, yet knowledge regarding the genetic determinants of this response is primarily limited to single-gene effects. Since very low-density lipoprotein (VLDL) is the central carrier of fasting TG, identifying factors that affect both total TG and VLDL-TG response to fenofibrate is critical for predicting individual fenofibrate response. As part of the Genetics of Lipid Lowering Drugs and Diet Network (GOLDN) study, 688 individuals from 161 families were genotyped for 91 single-nucleotide polymorphisms (SNPs) in 25 genes known to be involved in lipoprotein metabolism. Using generalized estimating equations to control for family structure, we performed linear modeling to investigate whether single SNPs, single covariates, SNP-SNP interactions, and/or SNP-covariate interactions had a significant association with the change in total fasting TG and fasting VLDL-TG after 3 weeks of fenofibrate treatment. A 10-iteration fourfold cross-validation procedure was used to validate significant associations and quantify their predictive abilities. More than one-third of the significant, cross-validated SNP-SNP interactions predicting each outcome involved just five SNPs, showing that these SNPs are of key importance to fenofibrate response. Multiple variable models constructed using the top-ranked SNP--covariate interactions explained 11.9% more variation in the change in TG and 7.8% more variation in the change in VLDL than baseline TG alone. These results yield insight into the complex biology of fenofibrate response, which can be used to target fenofibrate therapy to individuals who are most likely to benefit from the drug.
Figures
Similar articles
-
Preferential reduction of very low density lipoprotein-1 particle number by fenofibrate in type IIB hyperlipidemia: consequences for lipid accumulation in human monocyte-derived macrophages.Atherosclerosis. 2001 Mar;155(1):251-60. doi: 10.1016/s0021-9150(00)00634-1. Atherosclerosis. 2001. PMID: 11223449 Clinical Trial.
-
Fenofibrate effect on triglyceride and postprandial response of apolipoprotein A5 variants: the GOLDN study.Arterioscler Thromb Vasc Biol. 2007 Jun;27(6):1417-25. doi: 10.1161/ATVBAHA.107.140103. Epub 2007 Apr 12. Arterioscler Thromb Vasc Biol. 2007. PMID: 17431185 Clinical Trial.
-
Genome-wide association study of triglyceride response to a high-fat meal among participants of the NHLBI Genetics of Lipid Lowering Drugs and Diet Network (GOLDN).Metabolism. 2015 Oct;64(10):1359-71. doi: 10.1016/j.metabol.2015.07.001. Epub 2015 Jul 3. Metabolism. 2015. PMID: 26256467 Free PMC article.
-
Omega-3 fatty acids eicosapentaenoic acid and docosahexaenoic acid and their mechanisms of action on apolipoprotein B-containing lipoproteins in humans: a review.Lipids Health Dis. 2017 Aug 10;16(1):149. doi: 10.1186/s12944-017-0541-3. Lipids Health Dis. 2017. PMID: 28797250 Free PMC article. Review.
-
Combination of fenofibrate with non-statin drug regimens.Curr Pharm Des. 2010 Oct;16(30):3401-16. doi: 10.2174/138161210793563464. Curr Pharm Des. 2010. PMID: 20819059 Review.
Cited by
-
Effect of fenofibrate in 1113 patients at low-density lipoprotein cholesterol goal but high triglyceride levels: Real-world results and factors associated with triglyceride reduction.PLoS One. 2018 Oct 4;13(10):e0205006. doi: 10.1371/journal.pone.0205006. eCollection 2018. PLoS One. 2018. PMID: 30286170 Free PMC article.
-
Effects of variations in the APOA1/C3/A4/A5 gene cluster on different parameters of postprandial lipid metabolism in healthy young men.J Lipid Res. 2010 Jan;51(1):63-73. doi: 10.1194/jlr.M800527-JLR200. J Lipid Res. 2010. PMID: 19592705 Free PMC article.
-
Rare PPARA variants and extreme response to fenofibrate in the Genetics of Lipid-Lowering Drugs and Diet Network Study.Pharmacogenet Genomics. 2012 May;22(5):367-72. doi: 10.1097/FPC.0b013e328351a486. Pharmacogenet Genomics. 2012. PMID: 22336959 Free PMC article.
-
A genome-wide study of lipid response to fenofibrate in Caucasians: a combined analysis of the GOLDN and ACCORD studies.Pharmacogenet Genomics. 2016 Jul;26(7):324-33. doi: 10.1097/FPC.0000000000000219. Pharmacogenet Genomics. 2016. PMID: 27002377 Free PMC article.
-
The PPAR alpha gene is associated with triglyceride, low-density cholesterol and inflammation marker response to fenofibrate intervention: the GOLDN study.Pharmacogenomics J. 2013 Aug;13(4):312-7. doi: 10.1038/tpj.2012.9. Epub 2012 May 1. Pharmacogenomics J. 2013. PMID: 22547144 Free PMC article. Clinical Trial.
References
-
- Haymore BR, Parks JR, Oliver TG, Glister BC. Hypertriglyceridemia. Hosp Physician. 2005;41:17–24.
-
- Cullen P. Evidence that triglycerides are an independent coronary heart disease risk factor. Am J Cardiol. 2000;86:943–949. - PubMed
-
- Hopkins PN, Wu LL, Hunt SC, Brinton EA. Plasma triglycerides and type III hyperlipidemia are independently associated with premature familial coronary artery disease. J Am Coll Cardiol. 2005;45:1003–1012. - PubMed
-
- Ooi TC, Ooi DS. The atherogenic significance of an elevated plasma triglyceride level. Crit Rev Clin Lab Sci. 1998;35:489–516. - PubMed
-
- Yoshino G, Hirano T, Kazumi T. Dyslipidemia in diabetes mellitus. Diabetes Res Clin Pract. 1996;33:1–14. - PubMed
Publication types
MeSH terms
Substances
Grants and funding
LinkOut - more resources
Full Text Sources
Medical
Molecular Biology Databases
Research Materials
Miscellaneous
