

The epidemics of donations: logistic growth and power-laws
- PMID: 18213367
- PMCID: PMC2190793
- DOI: 10.1371/journal.pone.0001458
The epidemics of donations: logistic growth and power-laws
Abstract
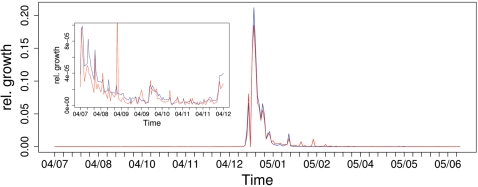
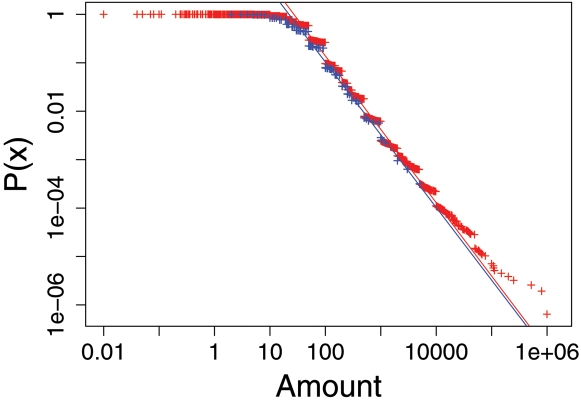
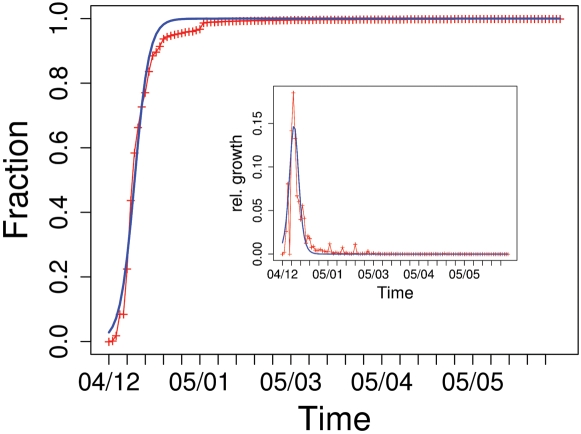
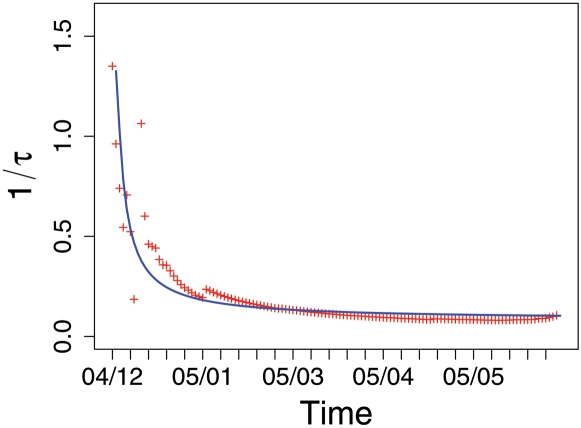
This paper demonstrates that collective social dynamics resulting from individual donations can be well described by an epidemic model. It captures the herding behavior in donations as a non-local interaction between individual via a time-dependent mean field representing the mass media. Our study is based on the statistical analysis of a unique dataset obtained before and after the tsunami disaster of 2004. We find a power-law behavior for the distributions of donations with similar exponents for different countries. Even more remarkably, we show that these exponents are the same before and after the tsunami, which accounts for some kind of universal behavior in donations independent of the actual event. We further show that the time-dependent change of both the number and the total amount of donations after the tsunami follows a logistic growth equation. As a new element, a time-dependent scaling factor appears in this equation which accounts for the growing lack of public interest after the disaster. The results of the model are underpinned by the data analysis and thus also allow for a quantification of the media influence.
Conflict of interest statement
Figures
References
-
- Couzin ID, Krause J. The social organisation of fish schools. Advances in Ethology, 2001;36(64)
-
- Schweitzer Frank, Mach Robert. Modeling vortex swarming in daphnia. Bulletin of Mathematical Biology, 2007;69:539–562. - PubMed
-
- Eguíluz MVíctor, Zimmermann GMartín. Transmission of information and herd behavior: An application to financial markets. Phys. Rev. Lett., 2000;85(5659) - PubMed
-
- Zheng B, Qiu T, Ren F. Two-phase phenomena, minority games, and herding models. Phys. Rev. E, 2004;69(046115) - PubMed
-
- Schwämmle V, González MC, Moreira AA, Andrade JS, Herrmann HJ. Different topologies for a herding model of opinion. Phys. Rev. E, 2007;75(066108) - PubMed
MeSH terms
LinkOut - more resources
Full Text Sources
