

Highly conserved non-coding sequences and the 18q critical region for short stature: a common mechanism of disease?
- PMID: 18213369
- PMCID: PMC2180198
- DOI: 10.1371/journal.pone.0001460
Highly conserved non-coding sequences and the 18q critical region for short stature: a common mechanism of disease?
Abstract
Background: Isolated growth hormone deficiency (IGHD) and multiple pituitary hormone deficiency (MPHD) are heterogeneous disorders with several different etiologies and they are responsible for most cases of short stature. Mutations in different genes have been identified but still many patients did not present mutations in any of the known genes. Chromosomal rearrangements may also be involved in short stature and, among others, deletions of 18q23 defined a critical region for the disorder. No gene was yet identified.
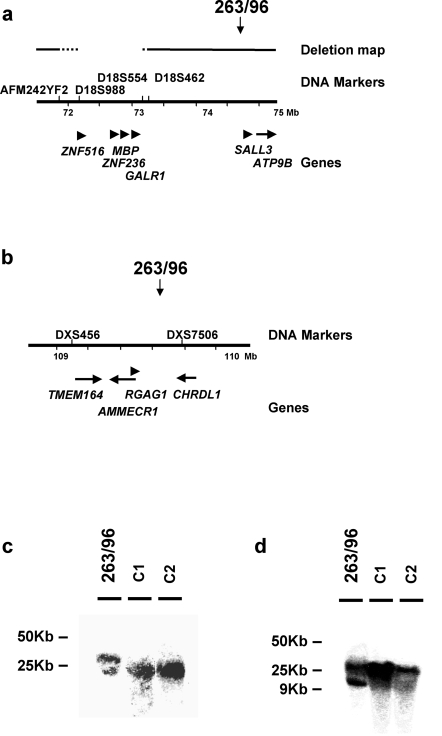
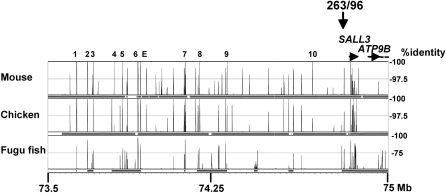
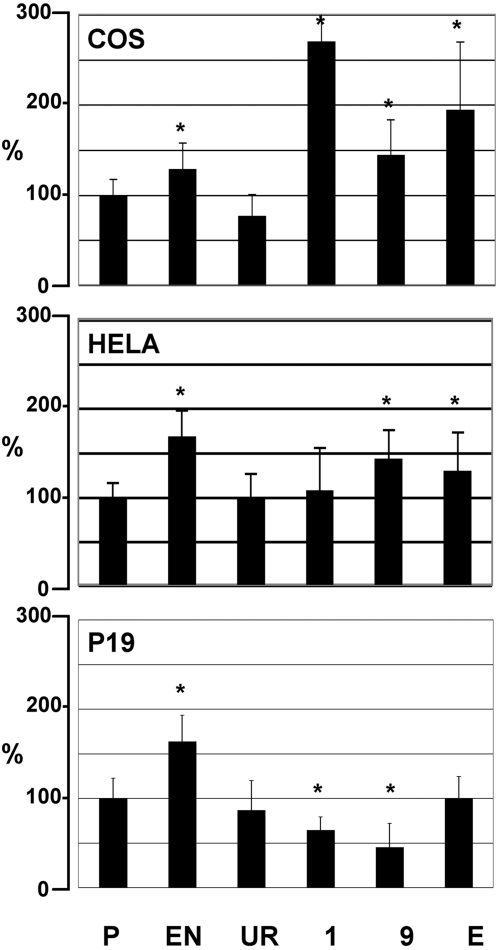
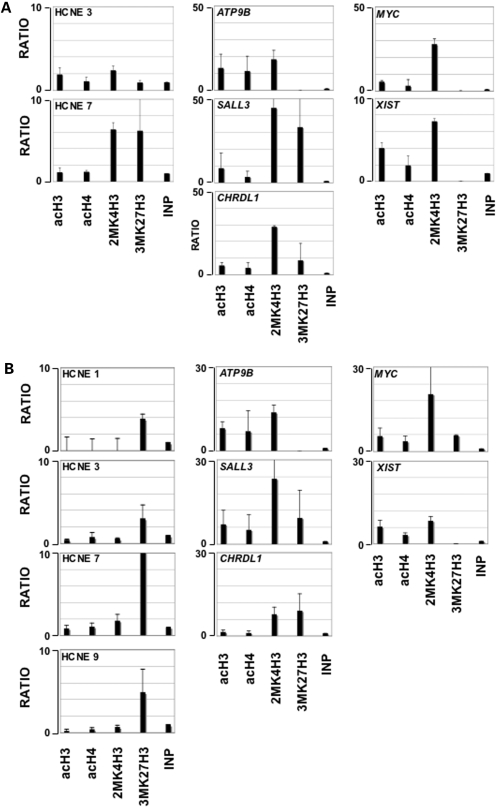
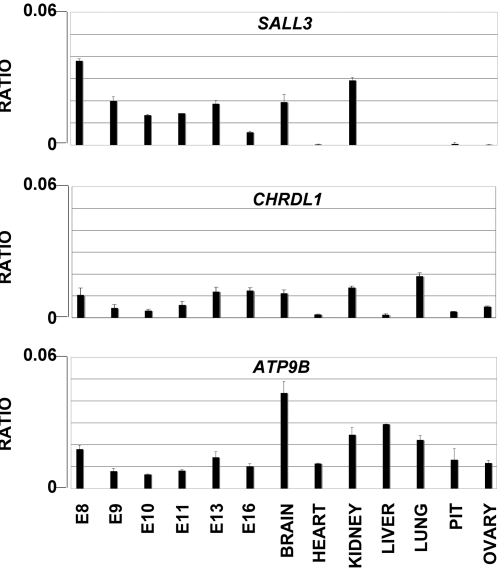
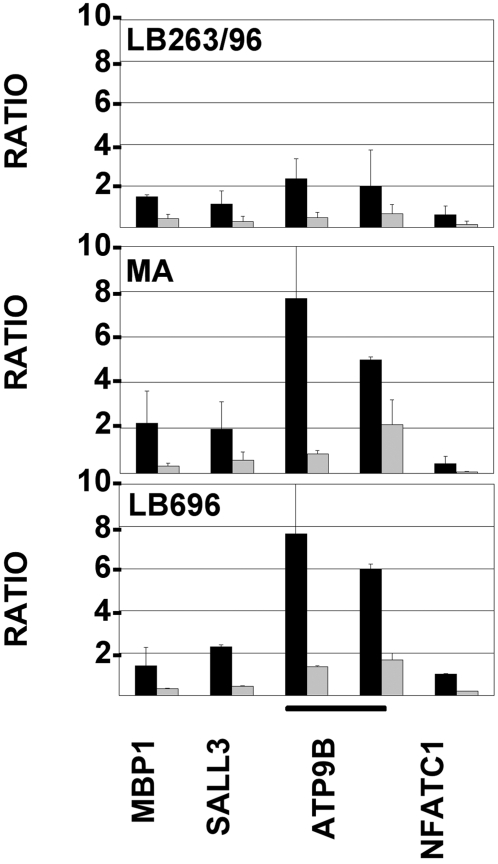
Methodology/principal findings: We now report a balanced translocation X;18 in a patient presenting a breakpoint in 18q23 that was surprisingly mapped about 500 Kb distal from the short stature critical region. It separated from the flanking SALL3 gene a region enriched in highly conserved non-coding elements (HCNE) that appeared to be regulatory sequences, active as enhancers or silencers during embryonic development.
Conclusion: We propose that, during pituitary development, the 18q rearrangement may alter expression of 18q genes or of X chromosome genes that are translocated next to the HCNEs. Alteration of expression of developmentally regulated genes by translocation of HCNEs may represent a common mechanism for disorders associated to isolated chromosomal rearrangements.
Conflict of interest statement
Figures
Similar articles
-
FISH-deletion mapping defines a 270-kb short stature critical interval in the pseudoautosomal region PAR1 on human sex chromosomes.Hum Genet. 1997 Aug;100(2):236-9. doi: 10.1007/s004390050497. Hum Genet. 1997. PMID: 9254856
-
Translocation (Y;22) resulting in the loss of SHOX and isolated short stature.Am J Med Genet A. 2004 Mar 1;125A(2):186-90. doi: 10.1002/ajmg.a.20346. Am J Med Genet A. 2004. PMID: 14981722
-
Molecular characterization of patients with 18q23 deletions.Am J Hum Genet. 1997 Apr;60(4):860-8. Am J Hum Genet. 1997. PMID: 9106532 Free PMC article.
-
Clinical Characteristics and Long-Term Recombinant Human Growth Hormone Treatment of 18q- Syndrome: A Case Report and Literature Review.Front Endocrinol (Lausanne). 2021 Dec 9;12:776835. doi: 10.3389/fendo.2021.776835. eCollection 2021. Front Endocrinol (Lausanne). 2021. PMID: 34956087 Free PMC article. Review.
-
Identification of 2.3-Mb gene locus for congenital aural atresia in 18q22.3 deletion: a case report analyzed by comparative genomic hybridization.Otol Neurotol. 2006 Apr;27(3):427-32. doi: 10.1097/00129492-200604000-00022. Otol Neurotol. 2006. PMID: 16639285 Review.
Cited by
-
Current concepts of follicle-stimulating hormone receptor gene regulation.Biol Reprod. 2011 Jan;84(1):7-17. doi: 10.1095/biolreprod.110.085043. Epub 2010 Aug 25. Biol Reprod. 2011. PMID: 20739665 Free PMC article. Review.
-
Retinoblastoma tumor-suppressor protein phosphorylation and inactivation depend on direct interaction with Pin1.Cell Death Differ. 2012 Jul;19(7):1152-61. doi: 10.1038/cdd.2011.202. Epub 2012 Feb 10. Cell Death Differ. 2012. PMID: 22322860 Free PMC article.
-
Long-read genome sequencing resolves complex genomic rearrangements in rare genetic syndromes.NPJ Genom Med. 2024 Dec 18;9(1):66. doi: 10.1038/s41525-024-00454-4. NPJ Genom Med. 2024. PMID: 39695126 Free PMC article.
-
pRb controls estrogen receptor alpha protein stability and activity.Oncotarget. 2013 Jun;4(6):875-83. doi: 10.18632/oncotarget.1036. Oncotarget. 2013. PMID: 23900261 Free PMC article.
References
-
- Dattani MT. Growth hormone deficiency and combined pituitary hormone deficiency: does the genotype matter? Clin Endocrinol (Oxf) 2005;63:121–130. - PubMed
-
- Mullis PE. Genetics of growth hormone deficiency. Endocrinol Metab Clin North Am. 2007;36:17–36. - PubMed
-
- Rainbow LA, Rees SA, Shaikh MG, Shaw NJ, Cole T, et al. Mutation analysis of POUF-1, PROP-1 and HESX-1 show low frequency of mutations in children with sporadic forms of combined pituitary hormone deficiency and septo-optic dysplasia. Clin Endocrinol (Oxf) 2005;62:163–168. - PubMed
-
- Kelberman D, Dattani MT. The role of transcription factors implicated in anterior pituitary development in the aetiology of congenital hypopituitarism. Ann Med. 2006;38:560–577. - PubMed
-
- Hale DE, Cody JD, Baillargeon J, Schaub R, Danney MM, et al. The spectrum of growth abnormalities in children with 18q deletions. J Clin Endocrinol Metab. 2000;85:4450–4454. - PubMed
Publication types
MeSH terms
Grants and funding
LinkOut - more resources
Full Text Sources
Molecular Biology Databases
