

Natural selection and adaptive evolution of leptin in the ochotona family driven by the cold environmental stress
- PMID: 18213380
- PMCID: PMC2194619
- DOI: 10.1371/journal.pone.0001472
Natural selection and adaptive evolution of leptin in the ochotona family driven by the cold environmental stress
Abstract
Background: Environmental stress can accelerate the evolutionary rate of specific stress-response proteins and create new functions specialized for different environments, enhancing an organism's fitness to stressful environments. Pikas (order Lagomorpha), endemic, non-hibernating mammals in the modern Holarctic Region, live in cold regions at either high altitudes or high latitudes and have a maximum distribution of species diversification confined to the Qinghai-Tibet Plateau. Variations in energy metabolism are remarkable for them living in cold environments. Leptin, an adipocyte-derived hormone, plays important roles in energy homeostasis.
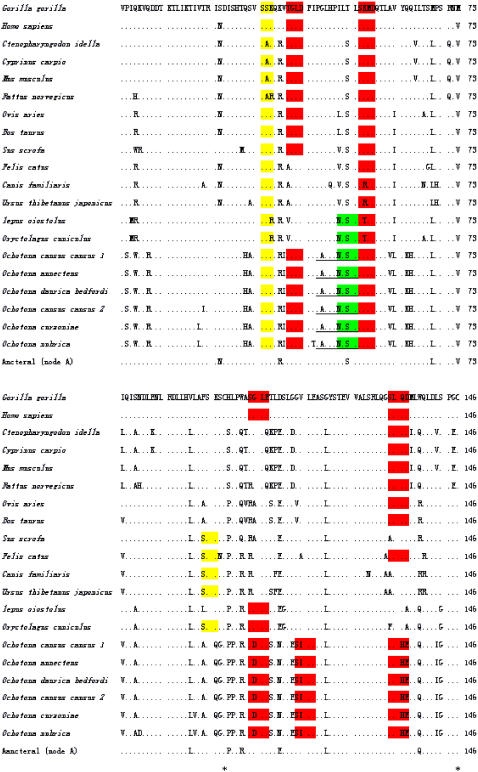
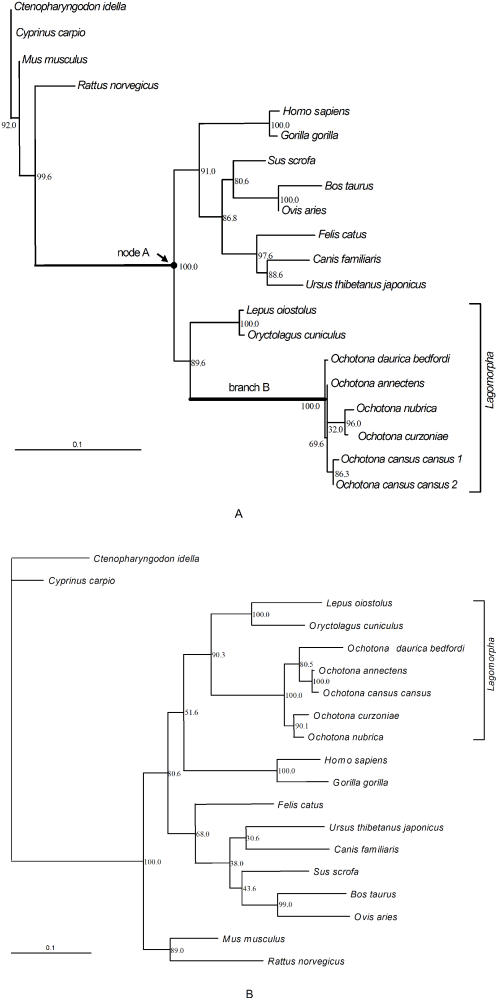
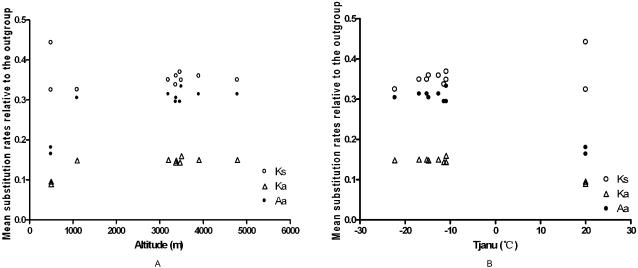
Methodology/principal findings: To examine the extent of leptin variations within the Ochotona family, we cloned the entire coding sequence of pika leptin from 6 species in two regions (Qinghai-Tibet Plateau and Inner Mongolia steppe in China) and the leptin sequences of plateau pikas (O. curzonia) from different altitudes on Qinghai-Tibet Plateau. We carried out both DNA and amino acid sequence analyses in molecular evolution and compared modeled spatial structures. Our results show that positive selection (PS) acts on pika leptin, while nine PS sites located within the functionally significant segment 85-119 of leptin and one unique motif appeared only in pika lineages-the ATP synthase alpha and beta subunit signature site. To reveal the environmental factors affecting sequence evolution of pika leptin, relative rate test was performed in pikas from different altitudes. Stepwise multiple regression shows that temperature is significantly and negatively correlated with the rates of non-synonymous substitution (Ka) and amino acid substitution (Aa), whereas altitude does not significantly affect synonymous substitution (Ks), Ka and Aa.
Conclusions/significance: Our findings support the viewpoint that adaptive evolution may occur in pika leptin, which may play important roles in pikas' ecological adaptation to extreme environmental stress. We speculate that cold, and probably not hypoxia, may be the primary environmental factor for driving adaptive evolution of pika leptin.
Conflict of interest statement
Figures
References
-
- Huntley B, Webb T. Migration: Species' response to climatic variations caused by changes in the earth's orbit. J Biogeogr. 1989;16:5–19.
-
- Wright BE. Does selective gene activation direct evolution? FEBS Lett. 1997;402:4–8. - PubMed
-
- Wright BE. Stress-directed adaptive mutations and evolution. Mol Microbiol. 2004;52:643–650. - PubMed
-
- Nielsen R. Molecular signatures of natural selection. Annu Rev Genet. 2005;39:197–218. - PubMed
Publication types
MeSH terms
Substances
LinkOut - more resources
Full Text Sources
