

A combination of rescoring and refinement significantly improves protein docking performance
- PMID: 18214977
- PMCID: PMC2696687
- DOI: 10.1002/prot.21920
A combination of rescoring and refinement significantly improves protein docking performance
Abstract
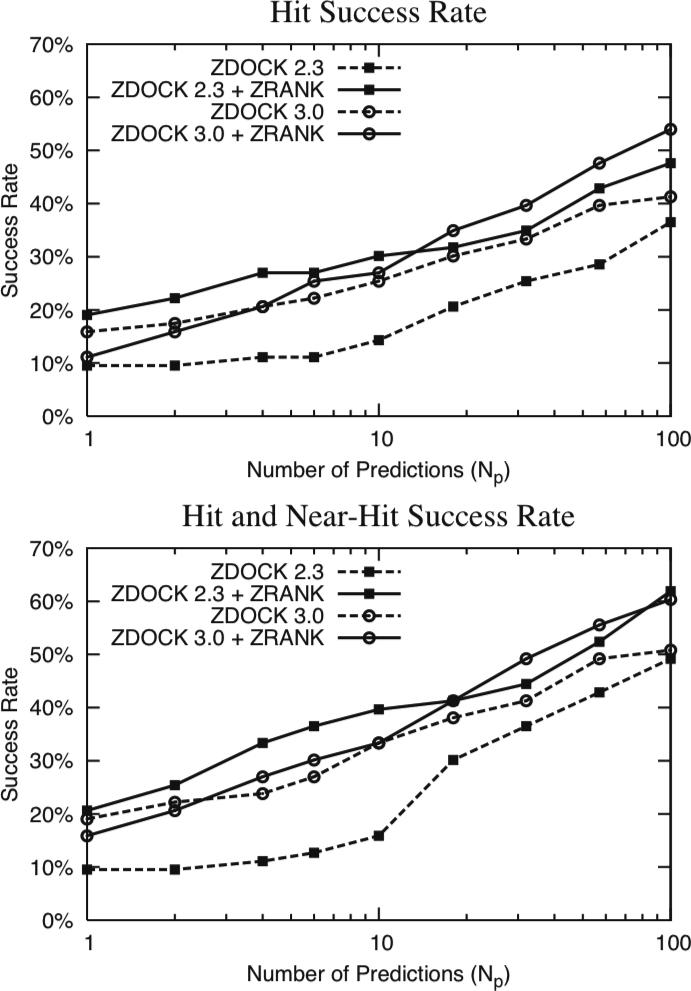
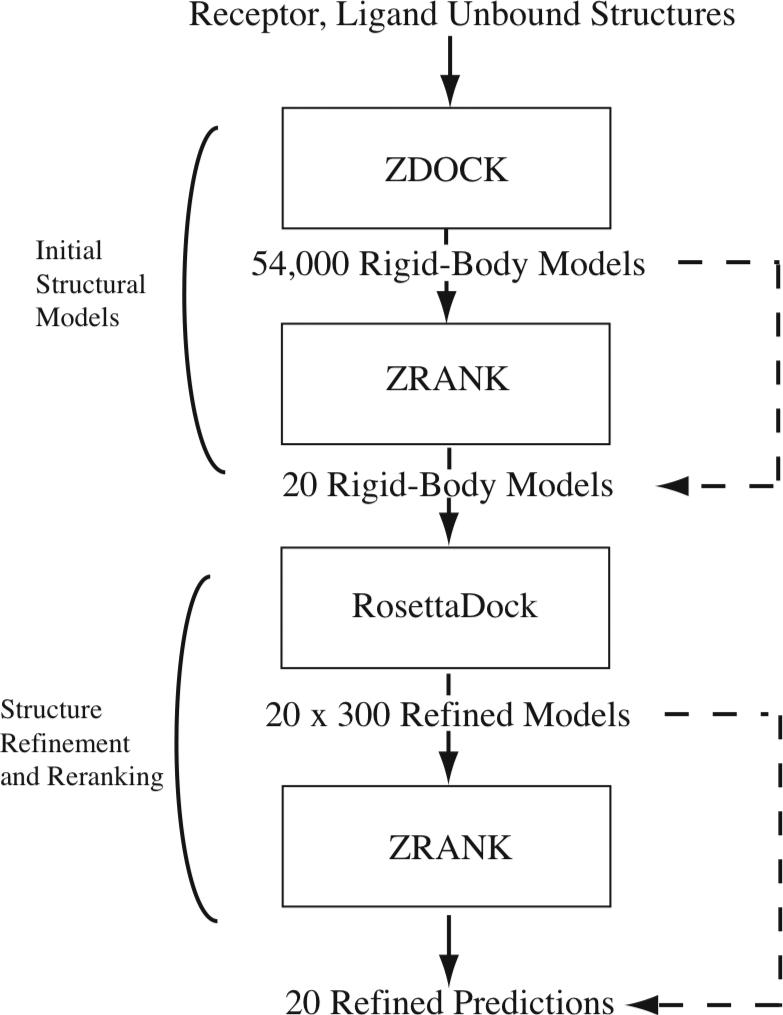
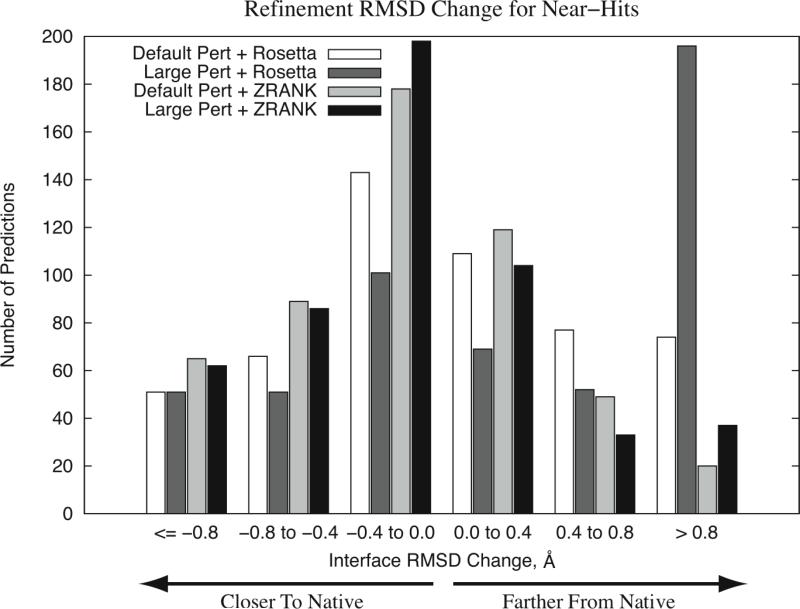
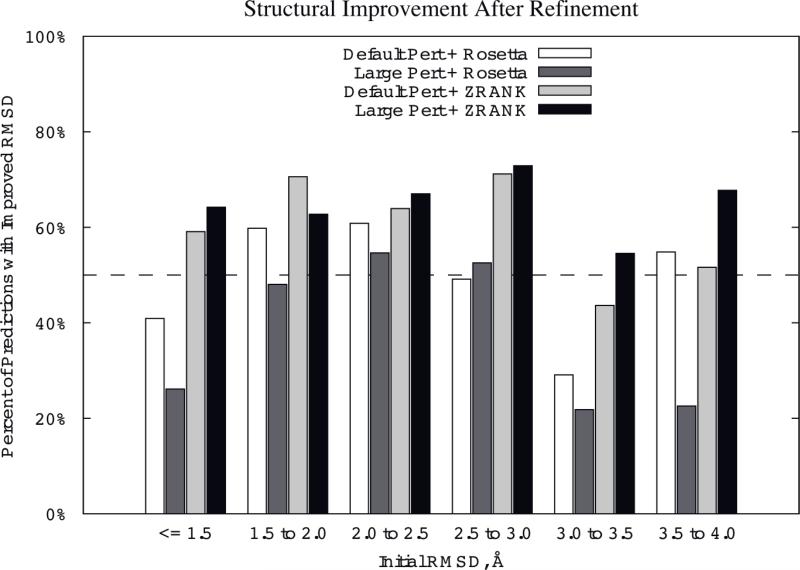
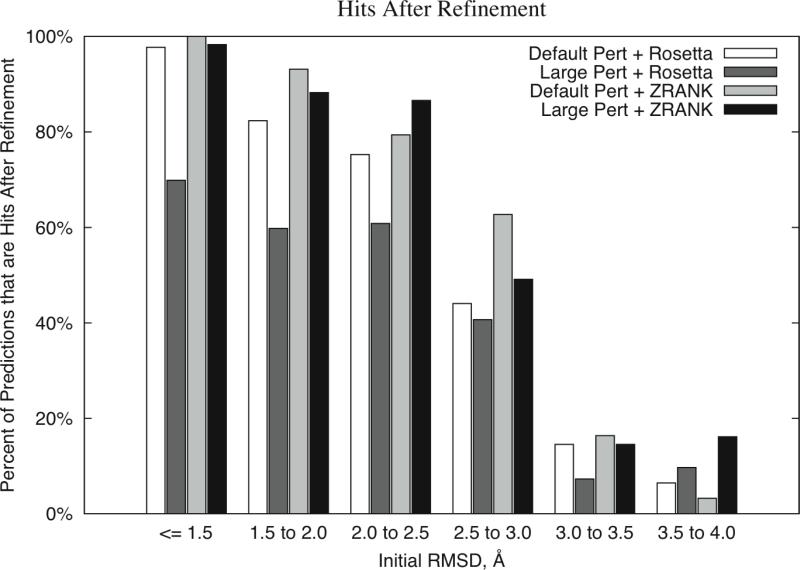
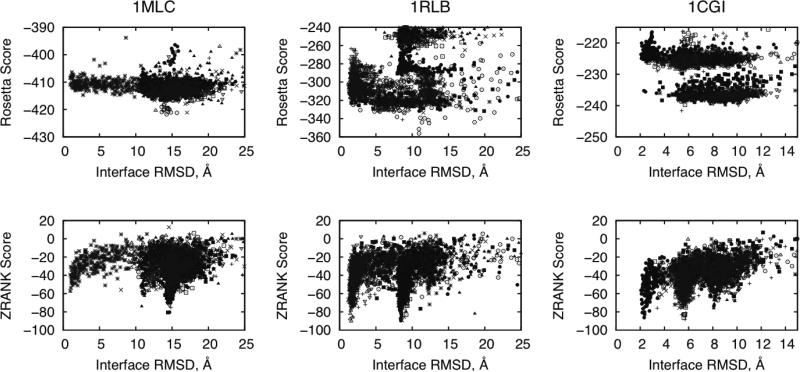
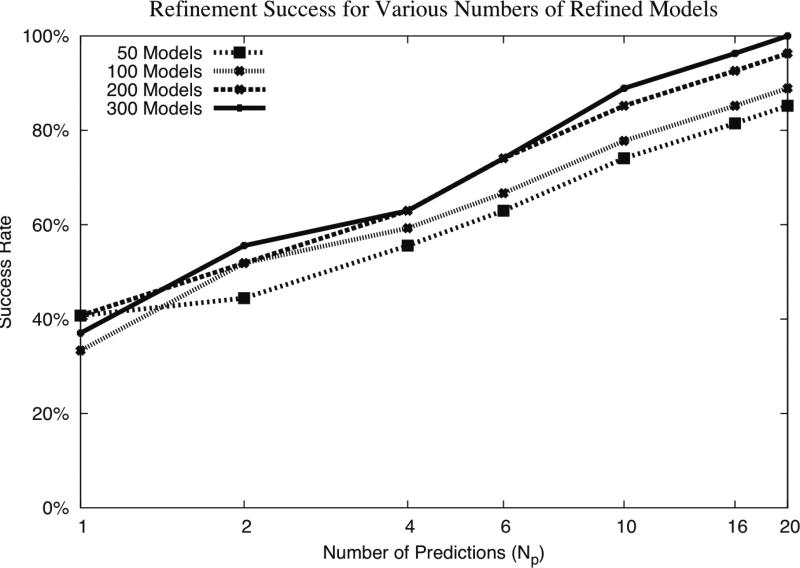
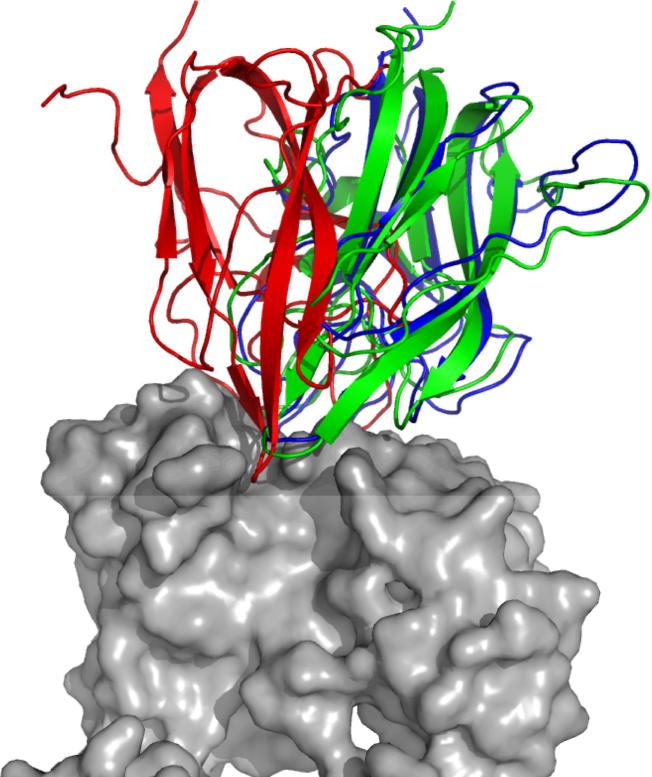
To determine the structures of protein-protein interactions, protein docking is a valuable tool that complements experimental methods to characterize protein complexes. Although protein docking can often produce a near-native solution within a set of global docking predictions, there are sometimes predictions that require refinement to elucidate correct contacts and conformation. Previously, we developed the ZRANK algorithm to rerank initial docking predictions from ZDOCK, a docking program developed by our lab. In this study, we have applied the ZRANK algorithm toward refinement of protein docking models in conjunction with the protein docking program RosettaDock. This was performed by reranking global docking predictions from ZDOCK, performing local side chain and rigid-body refinement using RosettaDock, and selecting the refined model based on ZRANK score. For comparison, we examined using RosettaDock score instead of ZRANK score, and a larger perturbation size for the RosettaDock search, and determined that the larger RosettaDock perturbation size with ZRANK scoring was optimal. This method was validated on a protein-protein docking benchmark. For refining docking benchmark predictions from the newest ZDOCK version, this led to improved structures of top-ranked hits in 20 of 27 cases, and an increase from 23 to 27 cases with hits in the top 20 predictions. Finally, we optimized the ZRANK energy function using refined models, which provides a significant improvement over the original ZRANK energy function. Using this optimized function and the refinement protocol, the numbers of cases with hits ranked at number one increased from 12 to 19 and from 7 to 15 for two different ZDOCK versions. This shows the effective combination of independently developed docking protocols (ZDOCK/ZRANK, and RosettaDock), indicating that using diverse search and scoring functions can improve protein docking results.
2008 Wiley-Liss, Inc.
Figures
Similar articles
-
ZRANK: reranking protein docking predictions with an optimized energy function.Proteins. 2007 Jun 1;67(4):1078-86. doi: 10.1002/prot.21373. Proteins. 2007. PMID: 17373710
-
Integrating atom-based and residue-based scoring functions for protein-protein docking.Protein Sci. 2011 Sep;20(9):1576-86. doi: 10.1002/pro.687. Epub 2011 Aug 8. Protein Sci. 2011. PMID: 21739500 Free PMC article.
-
The performance of ZDOCK and ZRANK in rounds 6-11 of CAPRI.Proteins. 2007 Dec 1;69(4):719-25. doi: 10.1002/prot.21747. Proteins. 2007. PMID: 17803212
-
Protein-protein docking tested in blind predictions: the CAPRI experiment.Mol Biosyst. 2010 Dec;6(12):2351-62. doi: 10.1039/c005060c. Epub 2010 Aug 19. Mol Biosyst. 2010. PMID: 20725658 Review.
-
Sampling and scoring: a marriage made in heaven.Proteins. 2013 Nov;81(11):1874-84. doi: 10.1002/prot.24343. Epub 2013 Aug 19. Proteins. 2013. PMID: 23775627 Free PMC article. Review.
Cited by
-
Prediction and validation of host-pathogen interactions by a versatile inference approach using Aspergillus fumigatus as a case study.Comput Struct Biotechnol J. 2022 Aug 5;20:4225-4237. doi: 10.1016/j.csbj.2022.07.050. eCollection 2022. Comput Struct Biotechnol J. 2022. PMID: 36051885 Free PMC article.
-
Pushing the Backbone in Protein-Protein Docking.Structure. 2016 Oct 4;24(10):1821-1829. doi: 10.1016/j.str.2016.06.025. Epub 2016 Aug 25. Structure. 2016. PMID: 27568930 Free PMC article.
-
Improved cluster ranking in protein-protein docking using a regression approach.Comput Struct Biotechnol J. 2021 Apr 20;19:2269-2278. doi: 10.1016/j.csbj.2021.04.028. eCollection 2021. Comput Struct Biotechnol J. 2021. PMID: 33995918 Free PMC article.
-
Deciphering cell wall sensors enabling the construction of robust P. pastoris for single-cell protein production.Biotechnol Biofuels Bioprod. 2023 Nov 17;16(1):178. doi: 10.1186/s13068-023-02428-7. Biotechnol Biofuels Bioprod. 2023. PMID: 37978550 Free PMC article.
-
A Kunitz-type peptide from Dendroaspis polylepis venom as a simultaneous inhibitor of serine and cysteine proteases.J Venom Anim Toxins Incl Trop Dis. 2020 Oct 7;26:e20200037. doi: 10.1590/1678-9199-JVATITD-2020-0037. eCollection 2020. J Venom Anim Toxins Incl Trop Dis. 2020. PMID: 33088285 Free PMC article.
References
-
- Chandonia JM, Brenner SE. The impact of structural genomics: expectations and outcomes. Science. 2006;311(5759):347–351. - PubMed
-
- Gray JJ. High-resolution protein-protein docking. Curr Opin Struct Biol. 2006;16(2):183–193. - PubMed
-
- Smith GR, Sternberg MJ. Prediction of protein-protein interactions by docking methods. Curr Opin Struct Biol. 2002;12(1):28–35. - PubMed
Publication types
MeSH terms
Substances
Grants and funding
LinkOut - more resources
Full Text Sources
Other Literature Sources
Miscellaneous
