Clinical Trial
. 2008 Jan 22;5(1):e8.
doi: 10.1371/journal.pmed.0050008.

Antitumor activity of rapamycin in a Phase I trial for patients with recurrent PTEN-deficient glioblastoma

Affiliations
Clinical Trial

Antitumor activity of rapamycin in a Phase I trial for patients with recurrent PTEN-deficient glioblastoma

Tim F Cloughesy et al. PLoS Med. .

Abstract

Background: There is much discussion in the cancer drug development community about how to incorporate molecular tools into early-stage clinical trials to assess target modulation, measure anti-tumor activity, and enrich the clinical trial population for patients who are more likely to benefit. Small, molecularly focused clinical studies offer the promise of the early definition of optimal biologic dose and patient population.

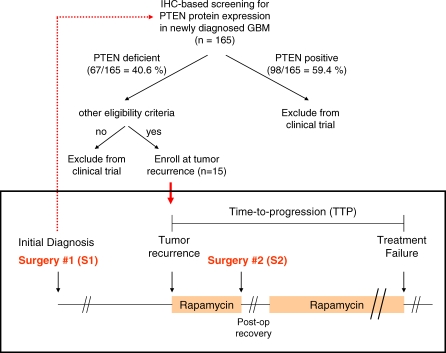
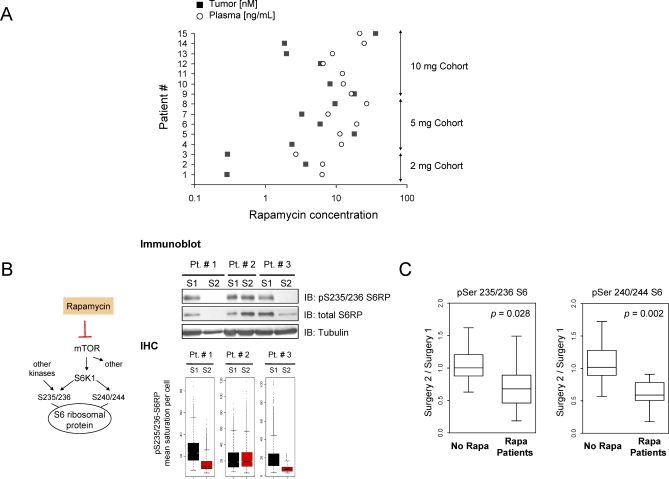
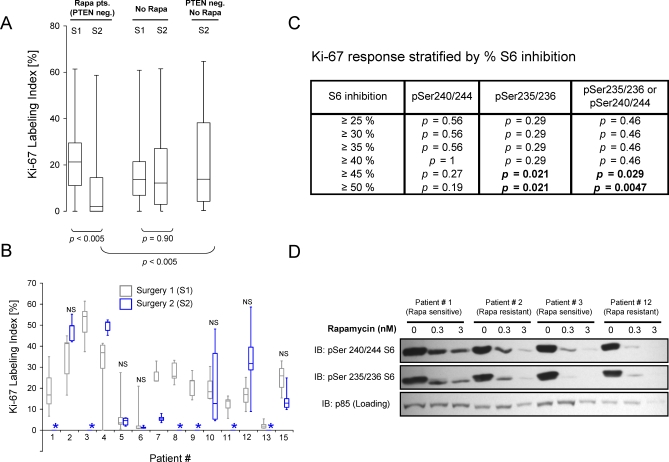
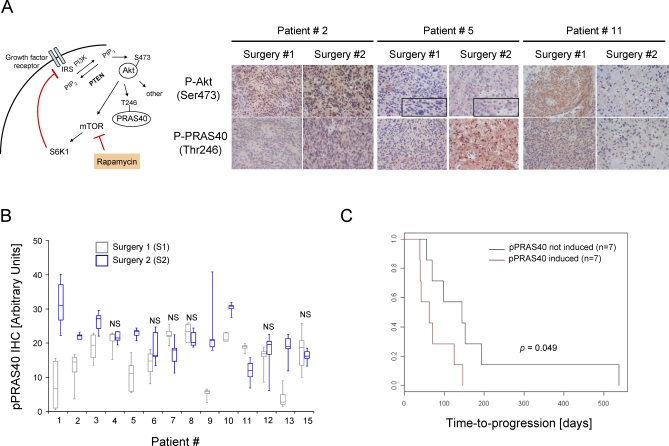
Methods and findings: Based on preclinical evidence that phosphatase and tensin homolog deleted on Chromosome 10 (PTEN) loss sensitizes tumors to the inhibition of mammalian target of rapamycin (mTOR), we conducted a proof-of-concept Phase I neoadjuvant trial of rapamycin in patients with recurrent glioblastoma, whose tumors lacked expression of the tumor suppressor PTEN. We aimed to assess the safety profile of daily rapamycin in patients with glioma, define the dose of rapamycin required for mTOR inhibition in tumor tissue, and evaluate the antiproliferative activity of rapamycin in PTEN-deficient glioblastoma. Although intratumoral rapamycin concentrations that were sufficient to inhibit mTOR in vitro were achieved in all patients, the magnitude of mTOR inhibition in tumor cells (measured by reduced ribosomal S6 protein phosphorylation) varied substantially. Tumor cell proliferation (measured by Ki-67 staining) was dramatically reduced in seven of 14 patients after 1 wk of rapamycin treatment and was associated with the magnitude of mTOR inhibition (p = 0.0047, Fisher exact test) but not the intratumoral rapamycin concentration. Tumor cells harvested from the Ki-67 nonresponders retained sensitivity to rapamycin ex vivo, indicating that clinical resistance to biochemical mTOR inhibition was not cell-intrinsic. Rapamycin treatment led to Akt activation in seven patients, presumably due to loss of negative feedback, and this activation was associated with shorter time-to-progression during post-surgical maintenance rapamycin therapy (p < 0.05, Logrank test).

Conclusions: Rapamycin has anticancer activity in PTEN-deficient glioblastoma and warrants further clinical study alone or in combination with PI3K pathway inhibitors. The short-term treatment endpoints used in this neoadjuvant trial design identified the importance of monitoring target inhibition and negative feedback to guide future clinical development.

Trial registration: http://www.ClinicalTrials.gov (#NCT00047073).


Conflict of interest statement

Competing Interests: The authors have declared that no competing interests exist.

Figures

Figure 1
Figure 1. Clinical Trial Design
Enrollment in the Phase I clinical trial was restricted to patients whose initial tumor resection (“surgery 1”) specimen was PTEN-deficient by immunohistochemistry. Patients were enrolled after failing standard therapy with radiation and chemotherapy (i.e., “tumor recurrence”). Prior to the scheduled salvage tumor resection (“surgery 2”), patients received a short course (mean: 7.5 d) of oral rapamycin. Rapamycin was resumed after recovery from surgery until patients developed clinical and/or radiographic evidence of treatment failure. The effects of rapamycin on tumor cell proliferation and mTOR signaling in tumor tissue were determined by comparing the tumor tissue collected during salvage resection (“surgery 2”) with a sample of the same tumor collected during the initial tumor resection (“surgery 1”). Time-to-progression (TTP) was defined as the interval between start of rapamycin therapy and postoperative treatment failure.
Figure 2
Figure 2. Rapamycin Crosses the Blood–Brain Barrier and Blocks mTOR in Tumor Tissue
(A) Rapamycin concentrations in tumor tissue (filled squares) and peripheral blood (empty circles) grouped by rapamycin dose cohorts (2 mg, 5 mg, or 10 mg per os daily). Intratumoral rapamycin concentration for patient 11 could not be determined due to insufficient frozen tumor material. The last preoperative dose of rapamycin was given on the day of craniotomy and peripheral blood was collected within 24 h of surgery. (B) Quantification of mTOR activity in tumor tissue by immunohistochemistry. The cartoon to the left depicts the S6 kinase 1 branch of the mTOR signaling pathway resulting in phosphorylation of S6 ribosomal protein at serine 235/236 and serine 240/244. The panel to the right shows a comparison between immunoblotting (top) and IHC (bottom) for the determination of S6 phosphorylation in tumor tissue from rapamycin patients 1, 2, and 3. The fold change in serine 235/236 phosphorylation between S2 and S1 for patients 1, 2, and 3 were 0.45, 1.01, and 0.45, respectively (see Figure S2A). (C) Changes in S6 phosphorylation between S2 and S1 (y-axis: ratio of S6 phosphorylation in S2 sample to S6 phosphorylation in S1 sample) for all patients for whom matched S1 and S2 samples were available (14/15 rapamycin patients and 9/9 patients who did not receive rapamycin). S6 phosphorylation was determined by IHC using phosphosite-specific antibodies against serine 235/236 (left) and serine 240/244 (right). Please see Figures S1 and S2 for details regarding IHC scoring method and results for individual tumors. p-values for the difference in mean S2/S1 ratios for each group were determined using the Kruskal Wallace test.
Figure 3
Figure 3. Rapamycin Inhibits Tumor Cell Proliferation in Subsets of PTEN-Deficient GBMs
(A) Ki-67 labeling index of GBMs before (S1) and during (S2) rapamycin therapy compared with tumor samples from patients who did not receive rapamycin (see text for detail). The horizontal line inside a box plot shows the median value. The lower and upper end of the box corresponds to the 25th and 75th percentile, respectively. The whiskers extend to the 95% range. The Wilcoxon nonparametric group comparison test was used to calculate p-values for the differences between different patient groups. (B) Changes in tumor cell proliferation between S1 and S2 for 14/15 rapamycin patients. The horizontal line inside the box indicates the median value. The lower and upper border of the box corresponds to the 25th and 75th percentile, respectively. The whiskers extend to the 95% range. Paraffin blocks from patient 14 were not sufficient for quantification. The median Ki-67 labeling index of the S2 specimen from patients 1, 3, 8, 9, 11, and 13 was 0 (indicated by asterix). N.S. indicates that the difference in Ki-67 labeling index not statistically significant at the 0.05 level according to the Wilcoxon test. (C) Relationship between the magnitude of S6 inhibition and Ki-67 response in S2 tumor samples from rapamycin-treated patients. p-values were determined by Fisher Exact test for different thresholds of pS6 inhibition. (D) Ex vivo rapamycin response of short-term cultures derived from tumors with in vivo S6 response (patients 1 and 3) or resistance (patients 2 and 12). Shown are S6 and p85 (loading) immunoblots of whole cell lysates 8 h after treatment with vehicle, 0.3 nM rapamycin, and 3 nM rapamycin.
Figure 4
Figure 4. Induction of Akt Signaling in a Subset of Rapamycin-Treated Tumors
(A) Determination of Akt activation in tumor tissue during mTOR inhibitor therapy. The left panel is a cartoon illustrating the mTOR/S6K1 dependent feedback loop of the PI3k-Akt pathway. The right panel shows changes in phosphorylation of the Akt-substrate PRAS40 (threonine 246) during rapamycin therapy correspond to changes in Akt phosphorylation (serine 473). Tumors from patients 2 and 5 show an increase in pAkt and pPRAS40 immunostaining during rapamycin treatment, whereas the tumor from patient 11 shows a decrease in the same markers on rapamycin. (B) Changes in PRAS40 phosphorylation between S1 and S2 for 14/15 rapamycin patients. The horizontal line inside the box indicates the median value. The lower and upper border of the box corresponds to the 25th and 75th percentile, respectively. The whiskers extend to the 95% range. Paraffin blocks from patient 14 were not sufficient for quantification. N.S. indicates that the difference in pPRAS40 staining intensity not statistically significant at the 0.05 level according to the Wilcoxon test. (C) Kaplan Meier analysis illustrating the relationship between pPRAS40 induction and time-to-tumor progression.

Comment in

Similar articles

Cited by

References

    1. Arteaga CL, Baselga J. Tyrosine kinase inhibitors: why does the current process of clinical development not apply to them? Cancer Cell. 2004;5:525–531. - PubMed
    1. Sarker D, Workman P. Pharmacodynamic biomarkers for molecular cancer therapeutics. Adv Cancer Res. 2007;96:213–268. - PubMed
    1. Michaelis LC, Ratain MJ. Measuring response in a post-RECIST world: from black and white to shades of grey. Nat Rev Cancer. 2006;6:409–414. - PubMed
    1. Smith IE, Walsh G, Skene A, Llombart A, Mayordomo JI, et al. A phase II placebo-controlled trial of neoadjuvant anastrozole alone or with gefitinib in early breast cancer. J Clin Oncol. 2007;25:3816–3822. - PubMed
    1. Dowsett M, Smith IE, Ebbs SR, Dixon JM, Skene A, et al. Prognostic value of Ki67 expression after short-term presurgical endocrine therapy for primary breast cancer. J Natl Cancer Inst. 2007;99:167–170. - PubMed

Publication types

MeSH terms

Associated data