. 2008 Jan 24;57(2):303-13.
doi: 10.1016/j.neuron.2007.11.035.

New experiences enhance coordinated neural activity in the hippocampus

Affiliations

New experiences enhance coordinated neural activity in the hippocampus

Sen Cheng et al. Neuron. .

Abstract

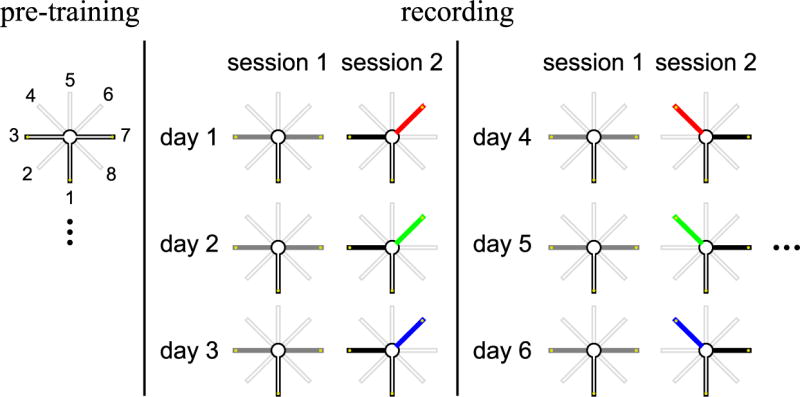
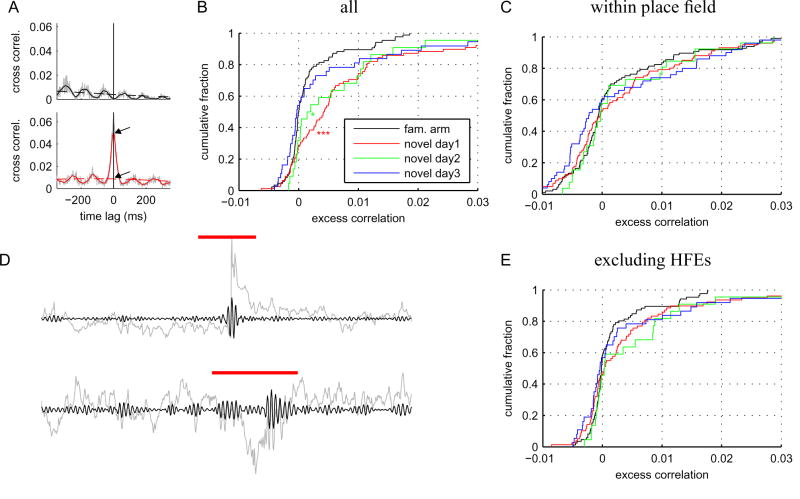
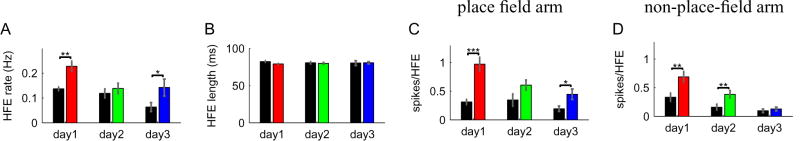
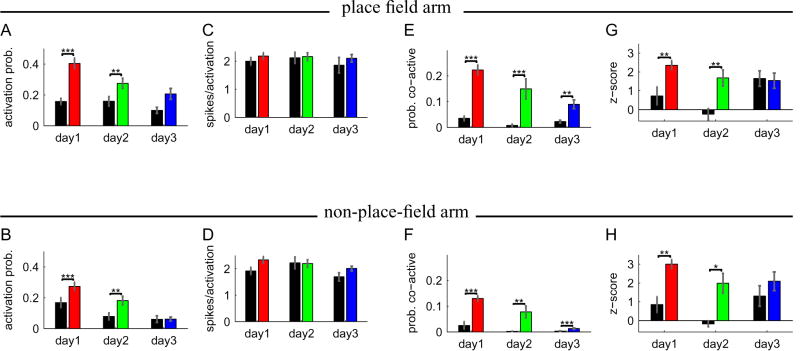
The acquisition of new memories for places and events requires synaptic plasticity in the hippocampus, and plasticity depends on temporal coordination among neurons. Spatial activity in the hippocampus is relatively disorganized during the initial exploration of a novel environment, however, and it is unclear how neural activity during the initial stages of learning drives synaptic plasticity. Here we show that pairs of CA1 cells that represent overlapping novel locations are initially more coactive and more precisely coordinated than are cells representing overlapping familiar locations. This increased coordination occurs specifically during brief, high-frequency events (HFEs) in the local field potential that are similar to ripples and is not associated with better coordination of place-specific neural activity outside of HFEs. As novel locations become more familiar, correlations between cell pairs decrease. Thus, hippocampal neural activity during learning has a unique structure that is well suited to induce synaptic plasticity and to allow for rapid storage of new memories.


Figures

Figure 1
Figure 1. Background and experimental setup
The schematic of the experimental setup shows a sample sequence of different T-maze configurations that were used in the experiment. In any given session only three out of the eight arms were accessible, closed arms are shown in gray outline. Only data that were obtained when animals were located on the outer arms indicated by filled bars were analyzed. The color scheme is maintained throughout the paper, with the exception of Fig. 8: pre-training maze configuration (grey), familiar arm in session 2 (black), and novel arm in session 2 on days 1, 2, and 3 of novel exposure (red, green, and blue, respectively). Each novel configuration was used for two or three days. Scale: The length of one arm is 75cm.
Figure 2
Figure 2. Increased correlations between novel arm cell pairs due to spiking within HFEs
A, Cross-correlogram (CCG) using all spikes for cell pairs recorded on different tetrodes on novel day 1 with place fields in familiar (top) and novel (bottom) arm. Shown are the raw CCG (grey line), a smoothed CCG using a Gaussian kernel (SD 5ms, solid red and black lines), and the envelope of the CCG (smoothed with a Gaussian kernel with SD 250ms, dashed red and black lines). The difference, measured at the points indicated by the arrows, is the excess correlation (see Methods). B, Cumulative distribution of excess correlation values in the population using all spikes. Novel arm cell pairs had higher excess correlation on day 1 (rank-sum test, n = 78, p = 1.8×10⁻⁴) and day 2 (n = 22, p = 0.035), but not on day 3 (n = 37, p = 0.74), than do the familiar arm cell pairs (all days pooled, n = 86). C, Differences in excess correlation between novel and familiar arm cell pairs disappeared when only spikes fired within place fields were included (p > 0.38). D, Sample of ripple with high peak amplitude of mean + 28.2 SD (top) and HFEs with low amplitude of mean + 3.9 SD (bottom). Ripple or HFE events are indicated by red lines above LFP traces (gray: raw signal, black: band-filtered [150-250 Hz] signal). Scale: LFP traces are 500 ms long, top red bar is ~ 80 ms. E, Excluding spikes fired during HFEs abolished the difference in excess correlation (p > 0.30).
Figure 3
Figure 3. Increased number of HFEs and increased spiking during HFEs
A, Average numbers of HFEs per second that the animal spent in the novel arm (red, green, and blue bars) and in the familiar arm (black bars) across three days of novel exposure. B: Mean duration of HFEs. C,D: Number of spikes during HFEs divided by the number of HFEs, averaged across cells. “Place field arm” (C) is the novel arm for novel arm cells, and familiar arm for familiar arm cells, “non-place-field arm” (D) is the other arm. Error bars represent standard errors across sessions. Symbols indicate results of rank-sum test (* p<0.05, ** p<0.01, *** p<0.001). Only within-day planned comparisons were performed.
Figure 4
Figure 4. Novel arm cells were initially more likely to be active and more coordinated during HFEs
Activity of cell assemblies representing the novel (red, green, and blue bars) and familiar arm (black bars) when animal was located on the place field and non-place-field arm. A,B: the probability of cells being active during a given HFE; C,D: average number of spikes fired per activation. E,F: the probability of cell pairs being co-active; G,H: the strength of the coordination of the co-activity measured as a z-score (see Methods). Symbols indicate results of rank-sum test (* p<0.05, ** p<0.01, *** p<0.001). Only within-day planned comparisons were performed.
Figure 5
Figure 5. Spiking of novel arm cells during HFEs was more precisely timed
A, Smoothed cross-correlograms (CCG) using only spikes that occurred during HFEs for two cell pairs with place fields on familiar (top) and novel (bottom) arm (see Methods). The RMS time lag was computed from the CCG between time lags of ±100 ms (gray-shaded areas). In these examples, the RMS time lags of the familiar and novel arm cell pairs are 41 ms and 27 ms, respectively. B, Cumulative distribution of RMS time lags across the population. Temporal coordination of novel arm cell pairs during HFEs was more precise on day 1 (rank-sum test, n = 77, p = 4.2×10⁻⁵) and day 2 (n = 18, p = 6.3×10⁻⁴) than that of familiar arm cell pairs (n = 27), but not on day 3 (n = 27, p= 0.17).
Figure 6
Figure 6. Phase precession in the novel arm was not more coordinated
A, Phase precession snapshot for one place field in the novel arm on day 1. Shown is the position-phase response after the animal spent 20 seconds in the novel arm. The colorbar (arbitrary units) represents the likelihood of spiking. The full evolution of this neuron’s firing across day 1 is shown in the Supplementary Video. B, Mean phase precession strength across all identified place fields within the first three minutes that the animal spend in the novel arm on day 1 (red), day 2 (green), and day 3 (blue), and in the familiar arm (black). The errorbars indicated standard errors. Only within-day planned comparisons were performed (rank-sum test, day 1: p = 0.014, day 2 and 3: p > 0.72).
Figure 7
Figure 7. Sequence compression in novel arm cell pairs was not more reliable
A, Schematic firing rate maps of three cells with overlapping place fields. Colored areas indicated elevated firing rate. Each cell shows phase precession that facilitates compression of behavioral sequences to spike sequences within one theta cycle. B, The theta-time scale separation between a pairs’ spiking is determined from the location of the highest peak in the cross-correlogram within ±100 ms (CCG peak, indicated by arrow). C: Sequence compression for familiar arm cell pairs (all days combined, n = 64). D-F, Sequence compression for novel arm cell pairs on D, day 1 (n = 78), E, day 2 (n = 18) and F, day 3 (n =4 0). The SCI was significantly lower in the novel arm than in the familiar arm on day 1 (z-test, p = 0.003) and day 2 (p = 0.001), but not on day 3 (p = 0.70).
Figure 8
Figure 8. Neural representation of the familiar arm remained stable
Unlike elsewhere in this paper red, green, and blue represent familiar arm cells on days 1, 2, and 3, respectively. A, Mean phase precession strength across all identified place fields within the first three minutes that the animal spend in the outer arms of the pre-training configuration (gray) and in the familiar arm of session 2 on days 1—3. The errorbars indicated standard errors. No pairwise comparison shows a significant difference (rank-sum test, p > 0.65) B, The sequence compression index (SCI) in familiar arm cell pairs (Fig. 7C) was not significantly different from SCI in the pre-training maze configuration shown here (n = 179, z-test, p = 0.48). C, Excess correlation in familiar arm cell pairs was not significantly different from excess correlation in the pre-training maze configuration (gray, n = 232) on day 1 (rank-sum, n = 26, p = 0.17) and day 2 (n = 18; p = 0.78). On day 3 the difference is significant (n = 42, p = 0.041) at the 0.05-level, however, the difference in excess correlation is very small. There were no significant differences between any two individual days (rank-sum, pairwise comparisons, p > 0.22).

Comment in

Similar articles

Cited by

References

    1. Amaral DG, Witter MP. Hippocampal Formation. In: Paxinos C, editor. The Rat Nervous System. Academic Press; 1995. pp. 443–493.
    1. Behrens CJ, van den Boom LP, de HL, Friedman A, Heinemann U. Induction of sharp wave-ripple complexes in vitro and reorganization of hippocampal networks. Nat Neurosci. 2005;8:1560–1567. - PubMed
    1. Bi GQ, Poo MM. Synaptic modifications in cultured hippocampal neurons: dependence on spike timing, synaptic strength, and postsynaptic cell type. J Neurosci. 1998;18:10464–10472. - PMC - PubMed
    1. Brown EN, Barbieri R, Ventura V, Kass RE, Frank LM. The Time-Rescaling Theorem and Its Application to Neural Spike Train Data Analysis. Neural Comput. 2002;14:325–346. - PubMed
    1. Brown EN, Nguyen DP, Frank LM, Wilson MA, Solo V. An analysis of neural receptive field dynamics by point process adaptive filtering. Proc Natl Acad Sci. 2001;98:12261–12266. - PMC - PubMed

Publication types

MeSH terms