. 2008 Apr 11;283(15):10109-23.
doi: 10.1074/jbc.M709545200. Epub 2008 Jan 23.

Galectin-1, -2, and -3 exhibit differential recognition of sialylated glycans and blood group antigens

Affiliations

Galectin-1, -2, and -3 exhibit differential recognition of sialylated glycans and blood group antigens

Sean R Stowell et al. J Biol Chem. .

Abstract

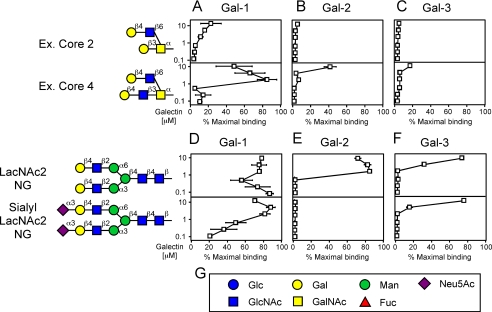
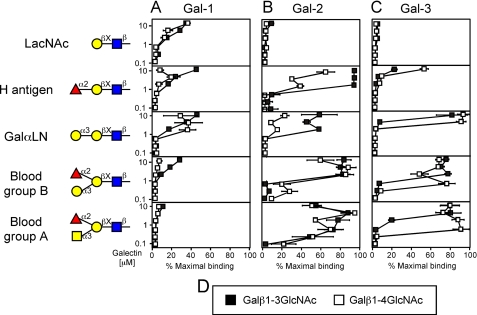
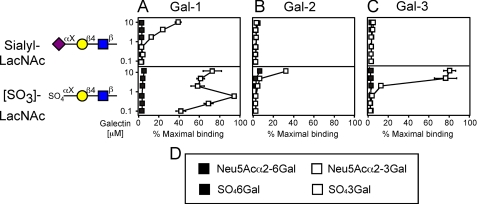
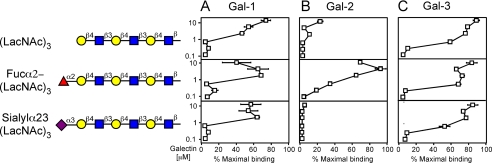
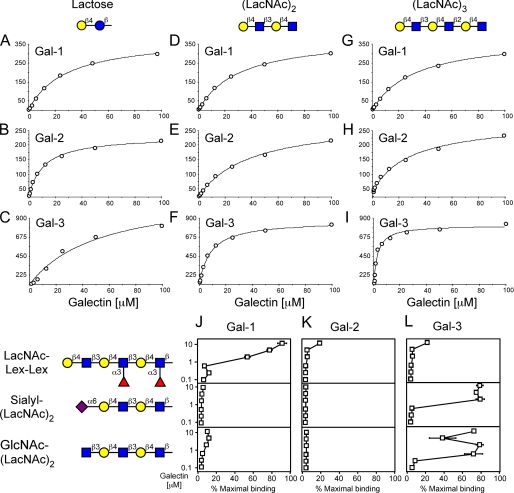
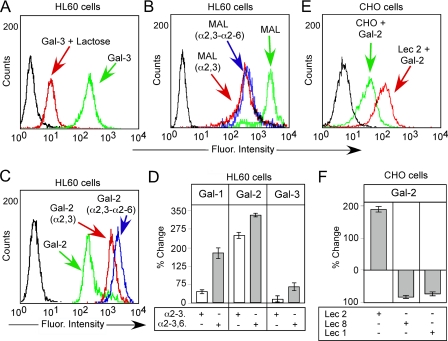
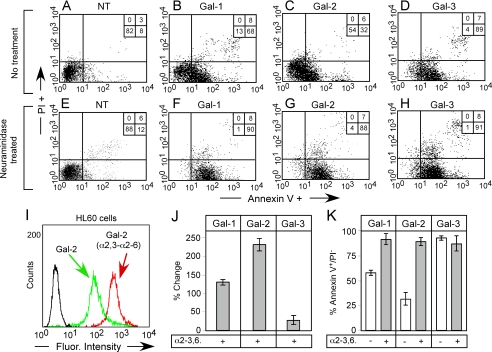
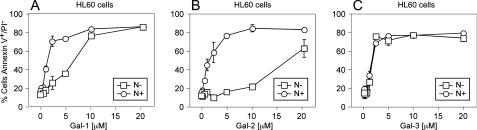
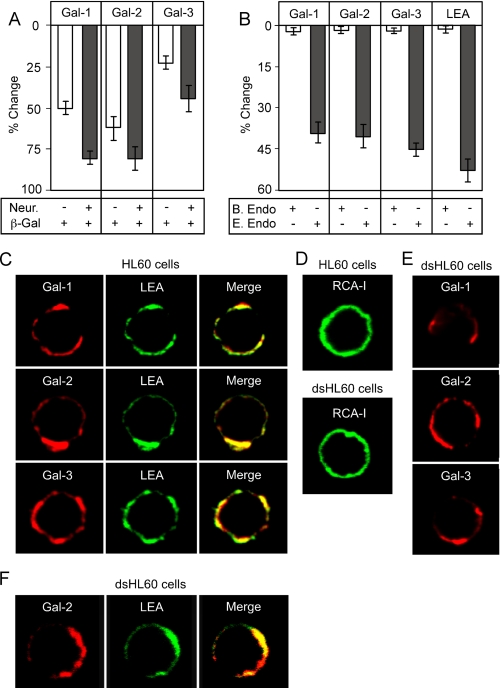
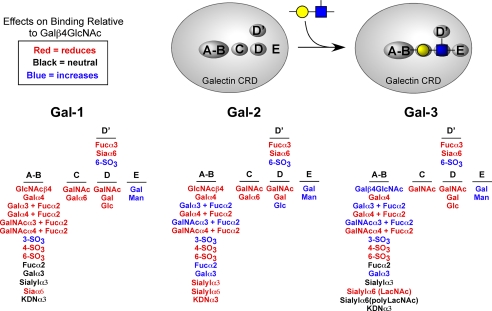
Human galectins have functionally divergent roles, although most of the members of the galectin family bind weakly to the simple disaccharide lactose (Galbeta1-4Glc). To assess the specificity of galectin-glycan interactions in more detail, we explored the binding of several important galectins (Gal-1, Gal-2, and Gal-3) using a dose-response approach toward a glycan microarray containing hundreds of structurally diverse glycans, and we compared these results to binding determinants on cells. All three galectins exhibited differences in glycan binding characteristics. On both the microarray and on cells, Gal-2 and Gal-3 exhibited higher binding than Gal-1 to fucose-containing A and B blood group antigens. Gal-2 exhibited significantly reduced binding to all sialylated glycans, whereas Gal-1 bound alpha2-3- but not alpha2-6-sialylated glycans, and Gal-3 bound to some glycans terminating in either alpha2-3- or alpha2-6-sialic acid. The effects of sialylation on Gal-1, Gal-2, and Gal-3 binding to cells also reflected differences in cellular sensitivity to Gal-1-, Gal-2-, and Gal-3-induced phosphatidylserine exposure. Each galectin exhibited higher binding for glycans with poly-N-acetyllactosamine (poly(LacNAc)) sequences (Galbeta1-4GlcNAc)(n) when compared with N-acetyllactosamine (LacNAc) glycans (Galbeta1-4GlcNAc). However, only Gal-3 bound internal LacNAc within poly(LacNAc). These results demonstrate that each of these galectins mechanistically differ in their binding to glycans on the microarrays and that these differences are reflected in the determinants required for cell binding and signaling. The specific glycan recognition by each galectin underscores the basis for differences in their biological activities.


Figures

FIGURE 1.
FIGURE 1.
Gal-1, Gal-2, and Gal-3 recognition of O-glycans and N-glycans. Trivial names followed by the structures of each glycan tested are shown. Recognition of each representative glycan is displayed as the percent bound when compared with the highest bound ligand at each concentration tested by each respective galectin tested in this study. Glycan recognition of O-glycans is shown for Gal-1 (A), Gal-2 (B), and Gal-3 (C). Glycan recognition of N-glycans is shown for Gal-1 (D), Gal-2 (E), and Gal-3 (F). G, legend of symbols for monosaccharides used in this study.
FIGURE 2.
FIGURE 2.
Gal-1, Gal-2, and Gal-3 recognition of LacNAc and LacNAc-derivative glycans. Trivial names followed by the structures of each glycan tested are shown. Recognition of each representative glycan is displayed as the percent bound when compared with the highest bound ligand by each respective galectin tested in this study. Glycan recognition is shown for Gal-1 (A), Gal-2 (B), and Gal-3 (C). D, legend for type 1 and type 2 structures. Black squares = type 1 LacNAc, white squares = type 2 LacNAc.
FIGURE 3.
FIGURE 3.
Gal-1, Gal-2, and Gal-3 recognition of sulfated LacNAc and sialylated LacNAc. Trivial names followed by the structures of each glycan tested are shown. Recognition of each representative glycan is displayed as the percent bound when compared with the highest bound ligand by each respective galectin tested in this study. Glycan recognition is shown for Gal-1 (A), Gal-2 (B), and Gal-3 (C). D, legend describing linkages of sulfate and sialic acid. Black squares represent binding toward the glycan with attachment of sialic acid or sulfate to the 6-OH of galactose. White squares represent binding toward the glycan with attachment of sialic acid or sulfate to the 3-OH of galactose.
FIGURE 4.
FIGURE 4.
Gal-1, Gal-2, and Gal-3 recognition of poly(LacNAc). Trivial names followed by the structures of each glycan tested are shown. Recognition of each representative glycan is displayed as the percent bound when compared with the highest bound ligand by each respective galectin tested in this study. Glycan recognition is shown for Gal-1 (A), Gal-2 (B), and Gal-3 (C).
FIGURE 5.
FIGURE 5.
Binding isotherms representing Gal-1, Gal-2, and Gal-3 recognition of lactose, (LacNAc)2, and (LacNAc)3 glycans using SPR. The binding isotherms and Kd values are shown for lactose with Gal-1 (A), Gal-2 (B), and Gal-3 (C); for (LacNAc)2 with Gal-1 (D), Gal-2 (E), and Gal-3 (F); and for (LacNAc)3 with Gal-1 (G), Gal-2 (H), and Gal-3 (I). J-L, trivial names followed by the structures of each glycan tested are shown. Recognition of each representative glycan is displayed as the percent bound when compared with the highest bound ligand by each respective galectin tested in this study. Glycan recognition is shown for Gal-1 (J), Gal-2 (K), and Gal-3 (L).
FIGURE 6.
FIGURE 6.
Gal-1, Gal-2, and Gal-3 recognition of sialylated LacNAc on HL60 cells. A, HL60 cells were incubated with 10 μg/ml Gal-3 with or without 50 mm lactose as indicated followed by flow cytometric analysis. B, HL60 cells were treated with S. typhimurium neuraminidase, an α2-3-specific neuraminidase, or C. perfringens α2-3-, α2-6-neuraminidase for 12 h followed by staining with 10 μg/ml M. amurensis (MAL) as indicated followed by flow cytometric analysis. C, HL60 treated as in B were stained with Gal-2 followed by analysis using flow cytometry. D, quantification of flow cytometric data. Bars represent the percent change in cell surface binding when compared with the mean fluorescent intensity of nontreated cells. E, representative histogram of Gal-2 binding to CHO cells and Lec 2 cells as indicated. F, quantification of flow cytometric data of Gal-2 binding toward CHO cells. Bars represent the percent change in cell surface binding when compared with the mean fluorescent intensity wild type CHO cells ± S.D.
FIGURE 7.
FIGURE 7.
Desialylation differentially alters cellular sensitivity toward galectin-induced PS exposure. A-H, HL60 cells were either incubated with buffer control (A-D) or 100 milliunits of A. ureafaciens neuraminidase (E-H) for 1 h followed by treatment of cells with 20 μm Gal-1, Gal-2, or Gal-3. Cells were washed in 50 mm lactose, stained with annexin-V FITC and propidium iodide (PI), followed by flow cytometric analysis. Cells that were annexin-V-positive and propidium iodide-negative were considered positive for PS exposure. Numbers represent the percent of total cells found in each quadrant. I, HL60 cells were treated with 100 milliunits of A. ureafaciens neuraminidase for 1 h, followed by staining with 10 μg/ml Gal-2 and analysis by flow cytometry. J, quantification of Gal-1, Gal-2, and Gal-3 binding toward HL60 cells following treatment with A. ureafaciens neuraminidase. Bars represent the percent change in cell surface binding when compared with the mean fluorescent intensity of nontreated cells ± S.D. K, quantification of PS exposure (annexin-V+/PI-) on neuraminidase-treated (NT) or untreated cells following treatment with Gal-1, Gal-2, or Gal-3 as outlined in A as mean percentage ± S.D.
FIGURE 8.
FIGURE 8.
Dose response of desialylated HL60 cells to Gal-1, Gal-2, and Gal-3. HL60 cells were incubated with either 100 milliunits of A. ureafaciens neuraminidase (circles) or buffer control (squares) for 1 h followed by treatment of cells with the indicated concentrations of Gal-1, Gal-2, or Gal-3 for 4 h. Cells were disengaged with 50 mm lactose and stained for PS exposure with annexin-V-FITC. The percent cells annexin V+/propidium iodide- are shown ± S.D.
FIGURE 9.
FIGURE 9.
Gal-1, Gal-2, and Gal-3 recognize poly(LacNAc) glycans on HL60 cells. A, Gal-1, Gal-2, and Gal-3 binding toward HL60 cells following treatment with jack bean β-galactosidase with or without pretreatment of cells with A. ure-afaciens neuraminidase. B, Gal-1, Gal-2, and Gal-3 binding toward HL60 cells following treatment with either B. fragilis or E. freundii endo-β-galactosidase. Bars represent the percent change in cell surface binding when compared with the mean fluorescent intensity of nontreated cells ± S.D. C, confocal analysis of Gal-1, Gal-2, Gal-3, and LEA binding toward cell surface glycans on HL60 cells. D, confocal analysis of RCA-I binding toward cell surface glycans on HL60 cells or HL60 cells treated with 100 milliunits A.ureafaciens neuraminidase (dsHL60). E, confocal analysis of Gal-1, Gal-2, Gal-3 binding toward cell surface glycans on HL60 cells treated with 100 milliunits of A. ureafaciens neuraminidase (dsHL60). F, confocal analysis of Gal-2 and LEA binding toward cell surface glycans on HL60 cells treated with 100 milliunits of A. ureafaciens neuraminidase (dsHL60).
FIGURE 10.
FIGURE 10.
Representative model of the CRD for Gal-1, Gal-2, and Gal-3 to illustrate the effect of LacNAc substitution on glycan recognition. Red indicates that the specific addition of the specified structure and linkage at the respective site reduces or abolishes recognition by the indicated galectin. Black refers to those modifications that had no effect on glycan recognition. Blue represents those modifications that produced more favorable binding than LacNAc alone.

References

    1. Camby, I., Le Mercier, M., Lefranc, F., and Kiss, R. (2006) Glycobiology 16 R137-R157 - PubMed
    1. Dumic, J., Dabelic, S., and Flogel, M. (2006) Biochim. Biophys. Acta 1760 616-635 - PubMed
    1. Leffler, H., Carlsson, S., Hedlund, M., Qian, Y., and Poirier, F. (2004) Glycoconj. J. 19 433-440 - PubMed
    1. Ilarregui, J. M., Bianco, G. A., Toscano, M. A., and Rabinovich, G. A. (2005) Ann. Rheum. Dis. 64 Suppl. 4, iv, 96-103 - PMC - PubMed
    1. Rubinstein, N., Ilarregui, J. M., Toscano, M. A., and Rabinovich, G. A. (2004) Tissue Antigens 64 1-12 - PubMed

Publication types