. 2008 Apr;82(7):3466-79.
doi: 10.1128/JVI.02478-07. Epub 2008 Jan 23.

Scavenger receptor class B is required for hepatitis C virus uptake and cross-presentation by human dendritic cells

Affiliations

Scavenger receptor class B is required for hepatitis C virus uptake and cross-presentation by human dendritic cells

Heidi Barth et al. J Virol. 2008 Apr.

Abstract

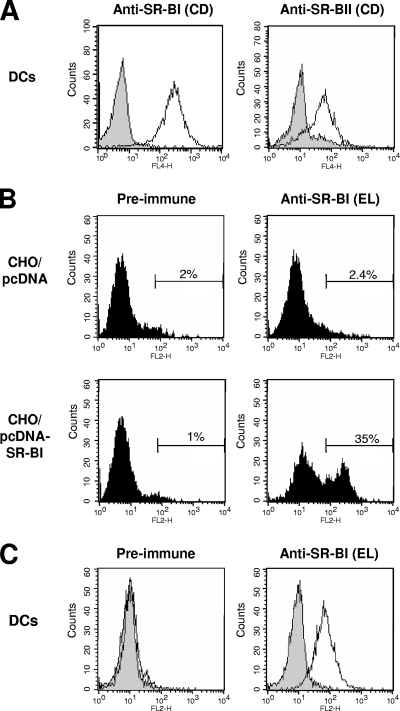
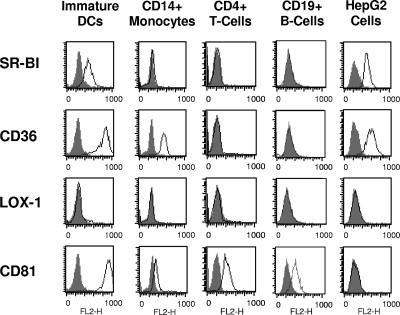
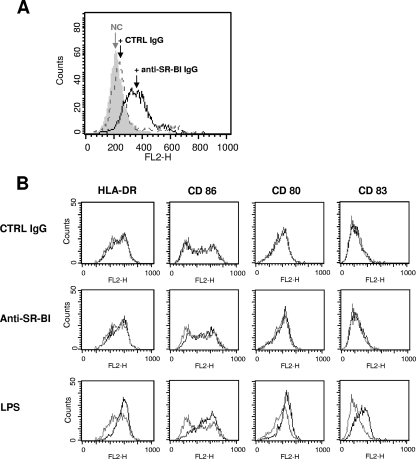
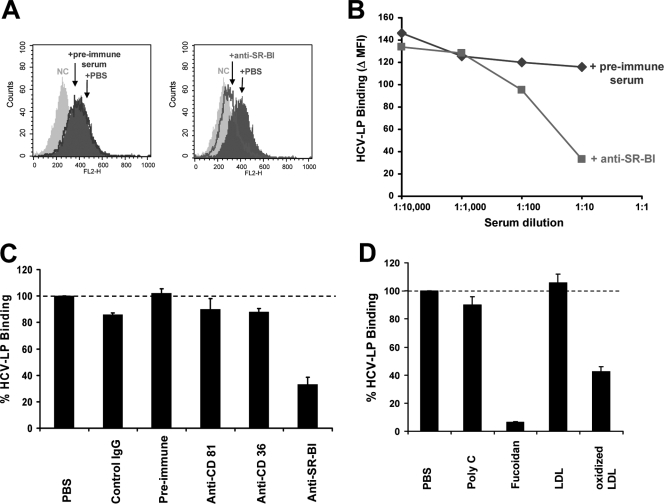
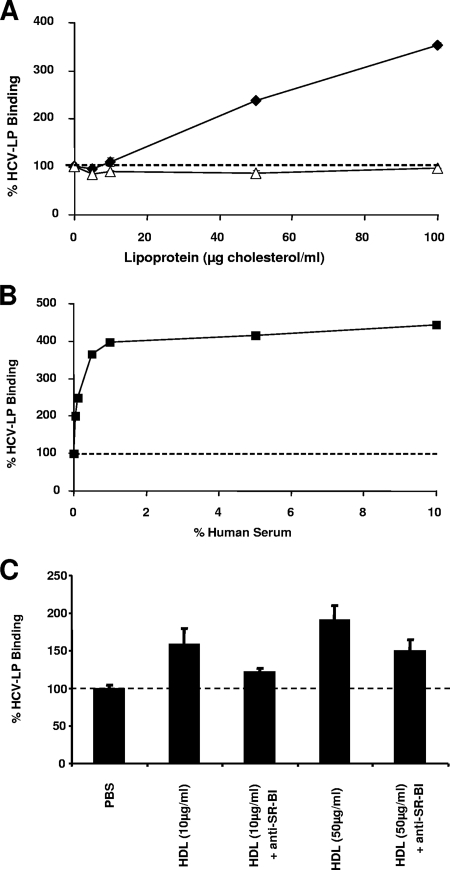
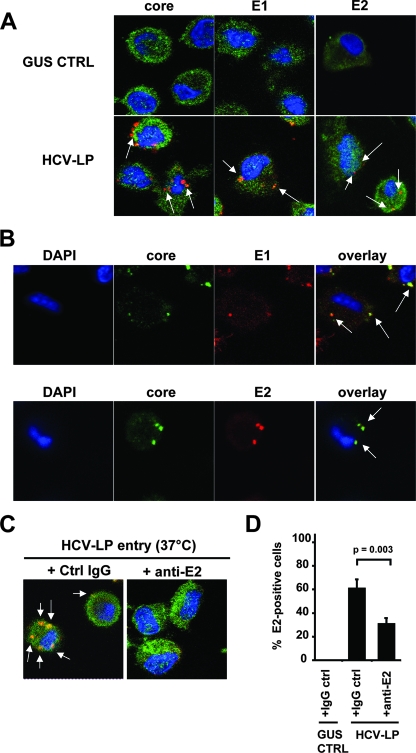
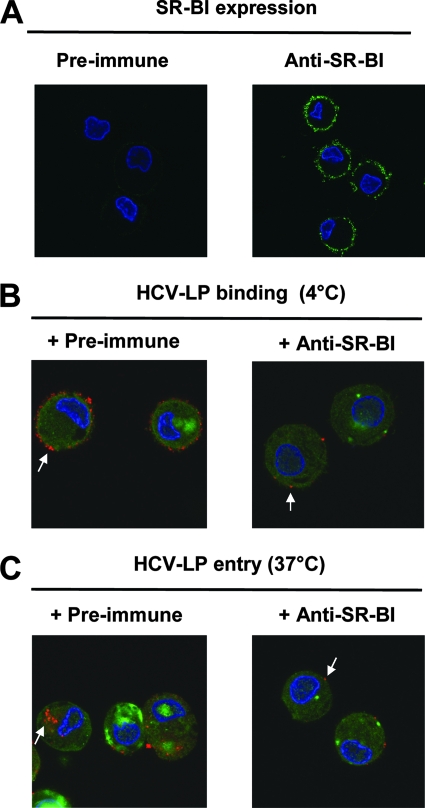
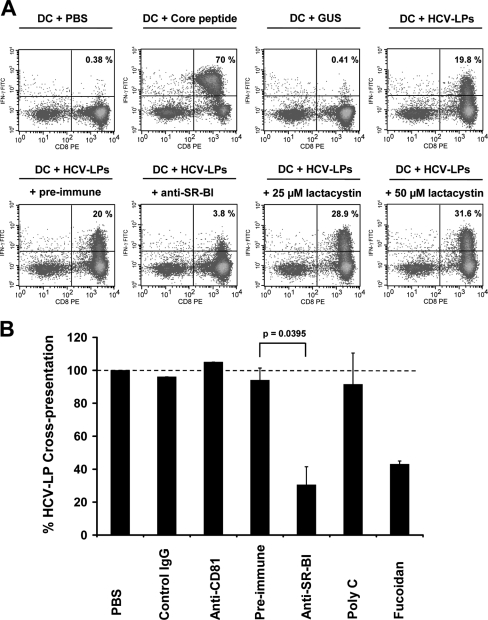
Class B scavenger receptors (SR-Bs) bind lipoproteins and play an important role in lipid metabolism. Most recently, SR-B type I (SR-BI) and its splicing variant SR-BII have been found to mediate bacterial adhesion and cytosolic bacterial invasion in mammalian cells. In this study, we demonstrate that SR-BI is a key host factor required for hepatitis C virus (HCV) uptake and cross-presentation by human dendritic cells (DCs). Whereas monocytes and T and B cells were characterized by very low or undetectable SR-BI expression levels, human DCs demonstrated a high level of cell surface expression of SR-BI similar to that of primary human hepatocytes. Antibodies targeting the extracellular loop of SR-BI efficiently inhibited HCV-like particle binding, uptake, and cross-presentation by human DCs. Moreover, human high-density lipoprotein specifically modulated HCV-like particle binding to DCs, indicating an interplay of HCV with the lipid transfer function of SR-BI in DCs. Finally, we demonstrate that anti-SR-BI antibodies inhibit the uptake of cell culture-derived HCV (HCVcc) in DCs. In conclusion, these findings identify a novel function of SR-BI for viral antigen uptake and recognition and may have an important impact on the design of HCV vaccines and immunotherapeutic approaches aiming at the induction of efficient antiviral immune responses.


Figures

FIG. 1.
FIG. 1.
SR-BI and SR-BII expression on human DCs. (A) SR-BI and SR-BII expression on human monocyte-derived DCs. Following fixation and permeabilization, DCs were incubated with rabbit anti-SR-BI (NB 400-104) and anti-SR-BII (NB 400-102) polyclonal antibodies directed against the SR-B cytoplasmic domain and subsequently stained with allophycocyanin-conjugated goat anti-rabbit IgG. Cells stained with the secondary antibody alone served as negative controls (gray-shaded curves). The x and y axes show mean fluorescence intensities and relative numbers of stained cells, respectively. (B) Specific binding of mouse anti-human SR-BI to SR-BI expressed in CHO cells. Anti-SR-BI polyclonal serum directed against the SR-BI extracellular loop was raised by genetic immunization of BALB/c mice with a plasmid carrying the full-length human SR-BI cDNA. CHO cells were transfected with pcDNA-SR-BI or control vector (pcDNA). Flow cytometry of SR-BI-transfected CHO cells incubated with mouse anti-human SR-BI polyclonal serum and PE-conjugated anti-mouse IgG demonstrated specific interaction of anti-SR-BI antibodies with human SR-BI. Numbers inside the panels represent the percentage of positively stained cells in relationship to the total number of cells. (C) Detection of cell surface SR-BI on DCs by anti-SR-BI. DCs were incubated with anti-SR-BI or preimmune serum and subsequently stained with PE-conjugated anti-mouse IgG. Cells stained with the secondary antibody alone served as negative controls (gray-shaded curves). CD, SR-BI/II cytoplasmic domain; EL, SR-BI extracellular loop; FL4/2-H, fluorescence 4/2-height.
FIG. 2.
FIG. 2.
SR expression on DCs and other cell types. Cell surface expression of SR was determined by flow cytometry using antibodies directed against SR-BI, CD36, LOX-1, or control antibody and preimmune serum. In addition, cells were stained for CD81 expression using a monoclonal anti-human CD81 antibody. Histograms corresponding to cell surface expression of the respective cell surface molecules (open curves) are overlaid with histograms of cells incubated with the appropriate isotype control (gray-shaded curves [NC]). FL2-H, fluorescence 2-height.
FIG. 3.
FIG. 3.
Binding of anti-SR-BI IgG and DC activation. (A) Cell surface expression of SR-BI detected by purified anti-SR-BI IgG. Cells were incubated with purified anti-SR-BI IgG or purified preimmune control IgG (CTRL IgG) and subsequently stained with PE-conjugated anti-rat IgG. Cells stained with the secondary antibody alone served as negative controls (gray-shaded curve [NC]). (B) Anti-SR-BI IgG and DC activation by anti-SR-BI IgG. Immature DCs were exposed to purified anti-SR-BI IgG, purified CTRL IgG (50 μg/ml each), or LPS (10 μg/ml). After 16 h, DC activation by purified anti-SR-BI IgG, CTRL IgG, or LPS was assessed by flow cytometric analysis of HLA-DR, CD80, CD86, and CD83 cell surface expression (dark lines). Histograms corresponding to background expression of the respective cell surface molecules in unexposed DCs are shown as gray lines. A result representative of three independent experiments using immature DCs from three different donors is shown. FL2-H, fluorescence 2-height.
FIG. 4.
FIG. 4.
SR-BI expression correlates with HCV-LP binding during DC differentiation. Analysis of SR-BI cell surface expression (A) and HCV-LP binding during differentiation of monocytes into DCs (B). Monocyte-derived DCs were harvested at different time points during culture in cytokine-conditioned medium. Then, monocytes and DCs were analyzed for SR-BI expression and HCV-LP binding. Expression of SR-BI was determined by flow cytometry using anti-SR-BI polyclonal serum as described in the Fig. 1 legend for panel C. HCV-LP binding to DCs was determined by flow cytometry using a monoclonal anti-HCV E2 antibody and PE-conjugated anti-mouse IgG. Data are shown as net mean fluorescence intensity (Δ MFI) of a representative experiment.
FIG. 5.
FIG. 5.
HCV-LP binding to human DCs is mediated by SR-BI. (A) DCs were preincubated with anti-SR-BI, preimmune serum, or PBS, and HCV-LP binding to DCs was determined by flow cytometry using a monoclonal anti-HCV E2 antibody and PE-conjugated anti-human IgG. The negative control (NC) histograms represent the results for DCs incubated with an insect cell control preparation. The x and y axes show mean fluorescence intensities and relative numbers of stained cells, respectively. (B) Concentration-dependent inhibition of HCV-LP binding to DCs by anti-SR-BI. Values are shown as net mean fluorescence intensity (Δ MFI) of duplicate measurements. (C) Specific inhibition of cellular HCV-LP binding by anti-SR-BI. Prior to the addition of HCV-LPs, DCs were preincubated with anti-CD36, anti-SR-BI, anti-CD81, control IgG, or preimmune serum. Cellular HCV-LP binding was determined as described above. Data are shown as percent HCV-LP binding (means ± standard deviations of the results from three experiments) relative to HCV-LP binding in the absence of antibodies (100%). (D) Inhibition of cellular HCV-LP binding by SR-B ligands. HCV-LP binding to DCs was determined in the presence of SR ligands fucoidan (1 μg/ml) and oxidized LDL (10 μg/ml) or the control ligands poly(C) (1 μg/ml) and LDL (10 μg/ml). Data are shown as percent HCV-LP binding (means ± standard deviations of the results from three independent experiments) relative to HCV-LP binding in the absence of ligands (100%). FL2-H, fluorescence 2-height.
FIG. 6.
FIG. 6.
HCV-LP binding to human DCs is enhanced by HDL. (A) Enhancement of HCV-LP binding to DCs by HDL. HCV-LPs were preincubated for 1 h at room temperature with different concentrations of HDL (diamonds) and LDL (triangles). After the addition of HCV-LP-lipoprotein complexes to the DCs, HCV-LP binding was determined as described in the Fig. 4 legend for panel A. Data are shown as percent HCV-LP binding (means ± standard deviations of the results from three experiments) in the presence of lipoproteins compared to HCV-LP binding in the presence of PBS (100%). (B) Enhancement of HCV-LP binding in the presence of lipoproteins present in human serum. HCV-LPs were preincubated with human serum from a healthy individual at the concentrations indicated and then added to DCs at 4°C, allowing HCV-LP binding. (C) HDL-mediated enhancement of HCV-LP binding is reversed by anti-SR-BI antibodies. HCV-LPs were incubated with HDL (10 μg cholesterol/ml or 50 μg cholesterol/ml) for 1 h at 37°C, while DCs were preincubated with or without anti-SR-BI serum (1:20) for 1 h at room temperature. Following the addition of HCV-LP-lipoprotein complexes to DCs incubated with anti-SR-BI or control, HCV-LP binding was determined using mouse anti-E2 MAb (AP33) as described above. Data are shown as percent HCV-LP binding (means ± standard deviations of the results from three independent experiments) relative to HCV-LP binding in the absence of ligands (100%).
FIG. 7.
FIG. 7.
HCV-LP uptake into DCs is mediated by envelope glycoprotein E2. (A) HCV-LP uptake by DCs. DCs were incubated with HCV-LPs or insect cell control preparations (GUS) and triple stained for actin (green); viral protein core, E1, or E2 (red); and nucleus (DAPI [4′,6′-diamidino-2-phenylindole], in blue). Arrows indicate viral protein staining. (B) HCV-LPs internalized in DCs. DCs incubated with HCV-LPs were triple stained for nucleus (DAPI, in blue), core (green), and E1 or E2 (red). Overlay of images shows colocalization of core/E1 or core/E2 (right panel). (C) HCV-LP uptake by DCs is mediated by envelope glycoprotein E2. HCV-LPs were preincubated (1 h at 37°C) with anti-E2 antibody (AP33; 50 μg/ml) or control IgG (50 μg/ml) before incubation with DCs. HCV-LP-anti-E2 complexes were then added to DCs and incubated at 37°C for 3 h. Following fixation, DCs were triple stained for actin (green), E2 (red), and nucleus (DAPI, in blue). (D) Quantitation of HCV-LP uptake in the presence and absence of anti-E2 antibody. HCV-LP uptake by DCs in the presence of anti-E2 MAb or control IgG is shown as percentage of cells with positive intracellular HCV-LP E2 staining relative to the total number of cells. The means ± standard deviations of the results from three independent experiments are shown. Statistical analysis was performed by Student's t test.
FIG. 8.
FIG. 8.
SR-BI mediates HCV-LP uptake into DCs. (A) SR-BI expression on the DC surface. DCs were incubated with anti-SR-BI or preimmune serum (1:10 dilution). After being washed with PBS, DCs were incubated with fluorescein isothiocyanate-conjugated anti-mouse IgG. Microphotographs illustrate SR-BI expression after incubation with preimmune serum (left panel) or anti-SR-BI (right panel). Nuclear staining (DAPI [4′,6′-diamidino-2-phenylindole]) is shown in blue. (B) For determination of HCV-LP binding, DCs were incubated with HCV-LPs at 4°C after preincubation of DCs with preimmune serum (left panel) or anti-SR-BI (right panel). Cell-bound HCV-LPs were detected by immunofluorescence using a monoclonal anti-HCV E2 antibody (red fluorescence). For costaining of cytoplasmic structures, cells were coincubated with an antiactin antibody (green fluorescence). (C) For determination of HCV-LP uptake, DCs were incubated with HCV-LPs at 37°C after preincubation of DCs with preimmune serum (left panel) or anti-SR-BI (right panel) and analyzed as described above. Arrows indicate HCV-LP staining.
FIG. 9.
FIG. 9.
SR-BI is involved in HCV-LP cross-presentation to HCV-specific CD8+ T cells. (A) HCV-LP cross-presentation in the presence of anti-SR-BI antibody. DCs were incubated with anti-SR-BI, control serum, or lactacystin prior to the addition of HCV-LPs, as described in Material and Methods. DCs incubated with HCV core peptide core36-53 or an insect cell lysate control preparation (GUS) served as positive and negative controls, respectively. After 24 h, DCs were cocultured with autologous HCV core-specific CD8+ T cells (recognizing an epitope in the HCV core protein comprising amino acids 36 to 53) and analyzed by flow cytometry after staining with antibodies to CD8 and IFN-γ. The percentages of CD8+ T cells that produced IFN-γ in the respective quadrants are indicated on the dot plots. FITC, fluorescein isothiocyanate. (B) HCV-LP cross-presentation in the presence of SR-B ligands, anti-SR-BI, and anti-CD81. Data are shown as percent HCV-LP cross-presentation relative to HCV-LP cross-presentation in the absence of the respective antibodies or SR-BI ligands (100%). Mean percentages ± standard deviations of the results of three independent experiments are shown for anti-SR-BI and preimmune serum. Statistical significance of differences between DCs preincubated with anti-SR-BI and control serum was determined by the two-tailed t test.
FIG. 10.
FIG. 10.
SR-BI mediates HCVcc uptake into DCs. (A) For analysis of HCVcc entry, DCs were incubated with PBS (left panel) or iodixanol gradient-purified JFH1 HCVcc (right panels) at 37°C as described in Materials and Methods. Internalized HCVcc were detected by immunofluorescence using a monoclonal anti-HCV E2 antibody (red fluorescence). For costaining of cytoplasmic structures, cells were coincubated with an antiactin antibody (green fluorescence). The nucleus is stained with DAPI (4′,6′-diamidino-2-phenylindole) (blue fluorescence). Arrows indicate HCVcc E2 protein. To study whether HCVcc uptake is mediated by SR-BI, DCs were preincubated with purified anti-SR-BI IgG or control IgG as described in Materials and Methods. (B) HCVcc uptake was quantified by counting the average number of cells with positive staining for HCVcc E2 protein per total cells (n = 300) in the presence or absence of purified anti-SR-BI IgG or control IgG. Results shown are the means and standard deviations of the results of three independent experiments (from three different DC preparations and two donors) performed in duplicate (number of HCV E2-positive cells for DCs incubated with HCVcc in the absence of purified antibody, 100%). Statistical significance of differences between the number of E2-positive DCs following preincubation with purified anti-SR-BI IgG compared to DCs preincubated with purified control IgG was determined by the two-tailed t test.

References

    1. Ackerman, A. L., and P. Cresswell. 2004. Cellular mechanisms governing cross-presentation of exogenous antigens. Nat. Immunol. 5678-684. - PubMed
    1. Barth, H., R. Cerino, M. Arcuri, M. Hoffmann, P. Schurmann, M. I. Adah, B. Gissler, X. Zhao, V. Ghisetti, B. Lavezzo, H. E. Blum, F. von Weizsacker, A. Vitelli, E. Scarselli, and T. F. Baumert. 2005. Scavenger receptor class B type I and hepatitis C virus infection of primary tupaia hepatocytes. J. Virol. 795774-5785. - PMC - PubMed
    1. Barth, H., T. J. Liang, and T. F. Baumert. 2006. Hepatitis C virus entry: molecular biology and clinical implications. Hepatology 44527-535. - PubMed
    1. Barth, H., C. Schafer, M. I. Adah, F. Zhang, R. J. Linhardt, H. Toyoda, A. Kinoshita-Toyoda, T. Toida, T. H. Van Kuppevelt, E. Depla, F. Von Weizsacker, H. E. Blum, and T. F. Baumert. 2003. Cellular binding of hepatitis C virus envelope glycoprotein E2 requires cell surface heparan sulfate. J. Biol. Chem. 27841003-41012. - PubMed
    1. Barth, H., A. Ulsenheimer, G. R. Pape, H. M. Diepolder, M. Hoffmann, C. Neumann-Haefelin, R. Thimme, P. Henneke, R. Klein, G. Paranhos-Baccala, E. Depla, T. J. Liang, H. E. Blum, and T. F. Baumert. 2005. Uptake and presentation of hepatitis C virus-like particles by human dendritic cells. Blood 1053605-3614. - PubMed

Publication types

MeSH terms