Comparative Study
. 2008 Jan 23;28(4):976-89.
doi: 10.1523/JNEUROSCI.2796-07.2008.

Currents in response to rapid concentration jumps of amphetamine uncover novel aspects of human dopamine transporter function

Affiliations
Comparative Study

Currents in response to rapid concentration jumps of amphetamine uncover novel aspects of human dopamine transporter function

Kevin Erreger et al. J Neurosci. .

Abstract

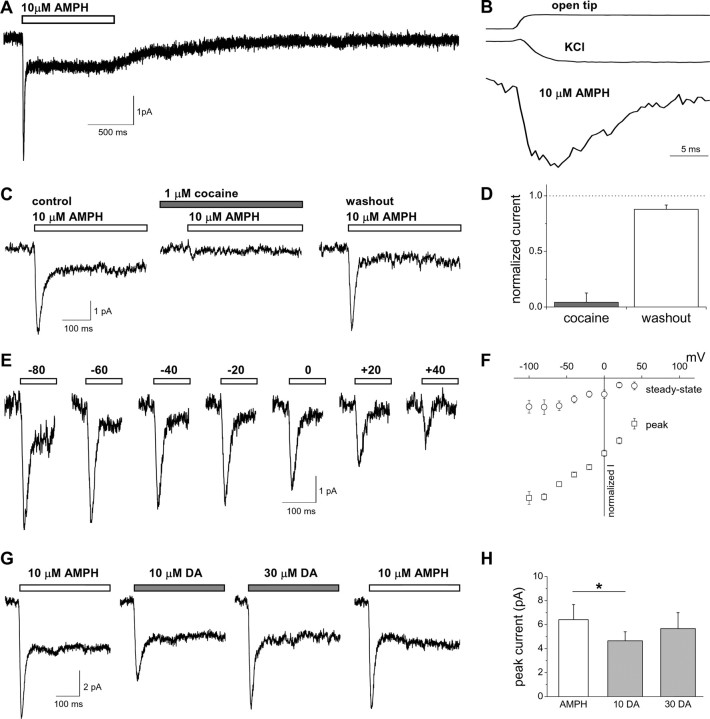
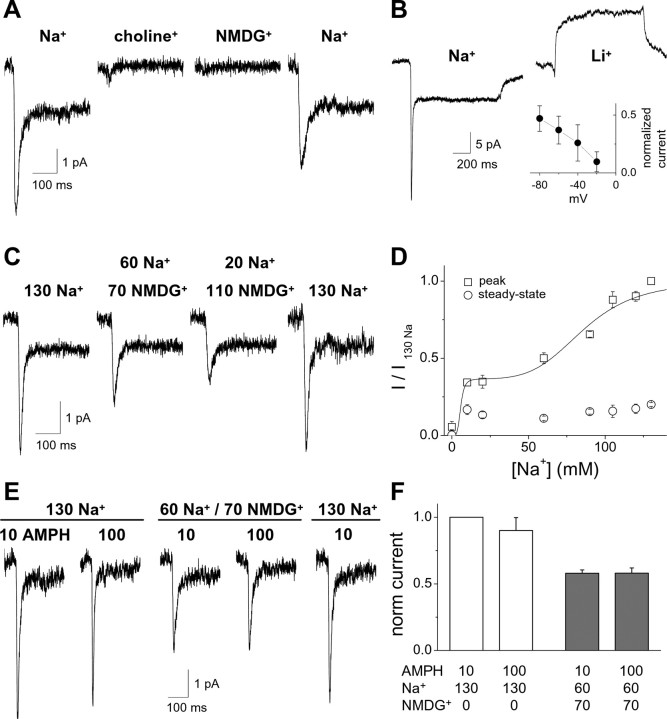
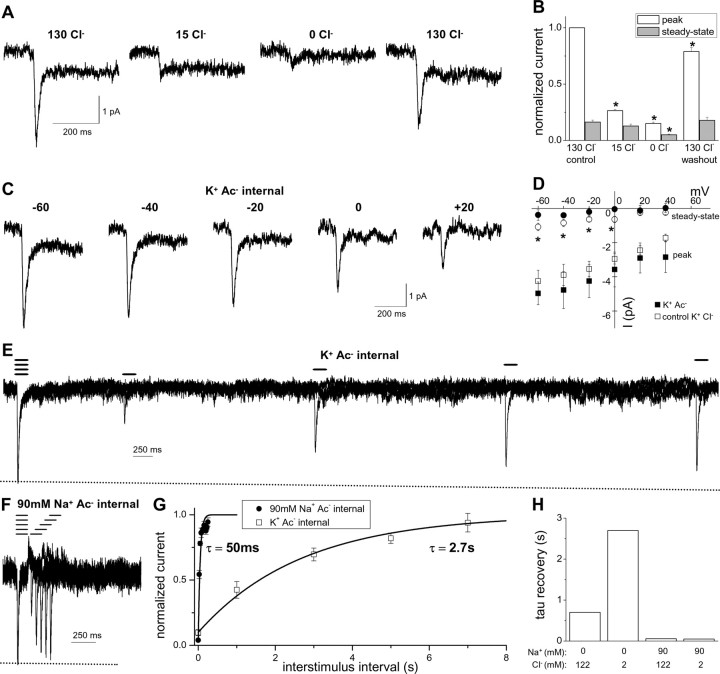
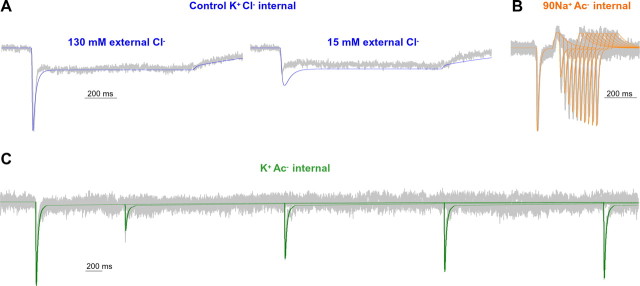
Amphetamine (AMPH) is a widely abused psychostimulant that acts as a substrate for the human dopamine transporter (hDAT). Using a piezoelectric rapid application system, we measured AMPH-induced currents mediated by hDAT. Whole-cell patch-clamp recordings in a heterologous expression system reveal that AMPH induces a rapidly activating and subsequently decaying inward current mediated by hDAT. We hypothesize that this transient inward current reflects a conformational change associated with substrate translocation. The AMPH-induced current strictly depends on extracellular Na+. Elevated intracellular Na+ has no effect on the peak AMPH-induced current amplitude but inhibits the steady-state current. In addition, elevated intracellular Na+ causes an overshoot outward current upon washout of AMPH that reflects hDAT locked in a Na+-exchange mode. Furthermore, elevated intracellular Na+ dramatically accelerates the recovery time from desensitization of the AMPH-induced current, revealing a new role for intracellular Na+ in promoting the transition to the hDAT "outward-facing" conformation. Ion substitution suggests that both extracellular and intracellular Cl- facilitate transporter turnover in contrast to the classical model of Cl- as a cotransported ion. We present an alternating-access model of hDAT function that accurately fits the main features of the experimental data. The model predicts that translocation of substrate occurs within milliseconds of substrate binding but that slow reorientation of the empty transporter is the rate-limiting factor for turnover. The model provides a framework for interpreting perturbations of hDAT activity.


Figures

Figure 1.
Figure 1.
Characterization of the AMPH-induced peak and steady-state currents mediated by hDAT. A, AMPH (10 μm) was applied for 1 s to hDAT cells under whole-cell voltage clamp (−60 mV). The mean current of 10 consecutive sweeps is plotted. B, The AMPH-induced current is plotted aligned with current obtained in response to switching from NaCl to KCl external (see Materials and Methods) to measure the time course of solution exchange around the cell (KCl). The current for the open pipette tip in response to switching from 1× to 0.5× external solution is plotted for comparison. All three currents were normalized to the maximal current recorded. C, The inward current induced by AMPH and obtained from a representative cell was blocked by the DAT inhibitor cocaine. The current recovers after washout of cocaine. D, The AMPH-induced peak current recorded during cocaine application or washout was normalized to the initial AMPH control response (n = 4). E, Representative currents recorded at different voltages in response to a 1 s application of AMPH. F, Current–voltage relationships of the AMPH-induced currents normalized to the peak current obtained at −60 mV (n = 4–6). G, hDAT-mediated currents induced by a 1 s application of AMPH or DA to the same cell at −60 mV. H, The peak current amplitude recorded either with 10 μm AMPH or with two different DA concentrations (n = 3; *p < 0.05, repeated-measures ANOVA).
Figure 2.
Figure 2.
Paired pulses of substrate indicate the turnover rate of hDAT. A, AMPH (10 μm) was applied for 100 ms with a paired-pulse protocol at a variable interval to monitor recovery from desensitization of the AMPH-induced peak current. Representative mean current of each interval is plotted normalized to the amplitude of the peak current obtained with the first AMPH application (dotted line). The lines above the current indicate the times of AMPH application. B, The normalized peak current is plotted as a function of time between AMPH applications to evaluate the recovery time from desensitization. The recovery time course is fitted to a single exponential function with a time constant of 700 ms (n = 6). C, DA (100 μm) was applied for 100 ms with a paired-pulse protocol at a variable interval to monitor recovery from desensitization of the DA-induced peak current. Representative mean current of each interval normalized to the amplitude of the peak current obtained with the first DA application (dotted line). D, The normalized peak current is plotted as a function of time between DA applications. The recovery time course is fitted to a single exponential function with a time constant of 703 ms (n = 4).
Figure 3.
Figure 3.
The amplitude and properties of the AMPH-induced current are concentration dependent. A, hDAT current evoked by a 1 s application of the indicated concentrations of AMPH to the same cell. B, The steady-state and peak currents for each AMPH concentration were normalized to the peak current obtained with 10 μm AMPH (n = 4–13 for each concentration). The dose–response relationship for the dependence of the peak current on the AMPH concentration exhibits two components with different apparent affinities for AMPH. The high apparent affinity component has an EC50 value of 0.036 μm and accounts for 38% of the current amplitude. The lower apparent affinity component has an EC50 value of 1.38 μm and accounts for 62% of the current amplitude. C, D, The kinetic properties (rise time and decay time constant) of the AMPH-induced current are plotted as a function of AMPH concentration.
Figure 4.
Figure 4.
The AMPH-induced inward current depends on extracellular Na+. A, Substituting external Na+ with choline+ or NMDG+ abolishes the current induced by AMPH (10 μm, 1 s). B, After substitution of Na+ by Li+, AMPH does not induce a desensitizing inward current but does induce an apparent outward current that may reflect inhibition of a Li+ leak current by AMPH (n = 6). Inset, The I–V relationship for the AMPH-induced current in Li+ normalized to the peak AMPH-induced current in Na+ (n = 4). C, Partial substitution of Na+ by NMDG+ results in a partial inhibition of the AMPH-induced current (concentrations are given in mm). D, The amplitude of the AMPH-induced current is shown as a function of Na+ with substitution by NMDG+ (n = 6–15). The dose–response relationship for the dependence of the peak current on the Na+ concentration exhibits two components with different apparent affinities for Na+. The high apparent affinity component accounts for 37% of the current amplitude and was saturated at the lowest Na+ concentration tested. For fitting the data, the EC50 value of the high apparent affinity component was set at 5 mm as an upper limit. The lower apparent affinity component exhibits an EC50 value of 86 mm and accounts for 63% of the current amplitude. E, F, Substitution of Na+ by NMDG+ reduces the peak current in response to 10 μm AMPH and 100 μm AMPH to a similar extent (n = 5). μm, AMPH concentration; mm, Na+ and NMDG+ concentrations.
Figure 5.
Figure 5.
Elevated intracellular Na+ regulates the AMPH-induced current. A, Representative current traces at different voltages with substitution of 90 mm Na+ for intracellular K+. The internal solution contained either 90 mm Na+ plus 30 mm K+ or control 120 mm K+. B, The I–V relationship for the peak current is not altered significantly by the presence of 90 mm intracellular Na+ (n = 6; p > 0.05, two-way ANOVA). The steady-state currents are significantly reduced by high intracellular Na+ (*p < 0.05, two-way ANOVA). C, Representative current evoked by a 1 s application of 10 μm AMPH with 90 mm Na+ internal solution. Inset, The amplitude of the overshoot current is voltage independent. The peak and overshoot currents are plotted as a function of voltage normalized to the peak current at −60 mV for each cell (n = 6). D, Charge transfer is quantified by integrating the inward peak current (Q peak) or the outward overshoot current (Q overshoot) at either 0 or −60 mV. The slope of the linear fit is 0.998 at 0 mV and 0.677 at −60 mV. E, F, The kinetic properties of the AMPH-induced current at −60 mV (rise time and decay time constant of the peak current) are plotted as a function of internal Na+ concentration (n = 5–10 for each Na+ concentration; ANOVA, *p < 0.05). G, H, The steady-state and overshoot currents, normalized to the peak current, are plotted against concentration of internal Na+ (n = 5–10 for each Na+ concentration; *p < 0.05).
Figure 6.
Figure 6.
Elevated intracellular Na+ accelerates recovery from desensitization to paired pulses of AMPH. A, AMPH (10 μm) was applied for 100 ms with a paired-pulse protocol at a variable interval to monitor recovery from desensitization. One representative cell is shown for 90 mm Na+ or 0 Na+ internal. B, The current in response to the second AMPH application, normalized to the current in response to the first application, is plotted against the time between the applications for 0 mm (open squares) and 90 mm (closed circle) internal Na+ (n = 6–9). The time constant (τ) for recovery from desensitization for each Na+ concentration was determined by fitting to a single exponential function. C, The time constants are plotted as a function of intracellular Na+ concentration (n = 5–9). Inset, The rate of recovery from desensitization (1/τ) correlates with the amplitude of the overshoot current across different intracellular Na+ concentrations.
Figure 7.
Figure 7.
In the presence of elevated intracellular Na+, intracellular substrate does not alter the overshoot current nor the recovery time from desensitization. A, B, At saturating intracellular Na+ concentrations (90 or 120 mm internal Na+), application of 10 μm AMPH to the same cell for either 100 ms or 1 s produces similar outward overshoot currents upon washout of AMPH (n = 9). In B, the overshoot current was normalized to the peak current. C, Washout of 10 μm AMPH upon a 1 s application produces an outward overshoot current in the presence of intracellular substrate (either AMPH or DA) and elevated intracellular Na+ (90 mm Na+). Representative traces from two different cells are displayed. D, With 90 mm intracellular Na+ (control), the presence of either 10 μm AMPH or 2 mm DA in the internal solution did not affect significantly the overshoot current recorded after washout of externally applied AMPH (p > 0.05, ANOVA; n = 7–10). E, AMPH was applied for 100 ms with a paired-pulse protocol at a variable interval to monitor recovery from desensitization. One representative cell is shown for 2 mm DA/90 mm Na+ internal. The time course is similar to that observed with high intracellular Na+ in the absence of intracellular substrate (see Fig. 7 for comparison). F, The current in response to the second AMPH application, normalized to the current in response to the first application, is plotted against the time between the applications in the presence or absence of the intracellular substrates (90 mm intracellular Na+; n = 6–9). G, The presence of internal substrate has no effect on recovery from desensitization in the presence of 90 mm intracellular Na+ (n = 6–9). AMPH, 10 μm AMPH; DA, 2 mm DA in the internal solution.
Figure 8.
Figure 8.
The AMPH-induced current depends on both external and internal Cl. A, Current traces in response to a 1 s application of 10 μm AMPH recorded in the presence of the indicated extracellular concentration of Cl substituted by Ac. B, The current for each condition was normalized to the control 130 mm Cl peak current for each cell (*p < 0.05, repeated measures ANOVA; n = 6). C, Current traces in response to a 1 s application of 10 μm AMPH recorded at different voltages with substitution of Ac for Cl as the predominant intracellular ion. The pipette solution (internal solution) contained 120 mm Ac plus 2 mm Cl (K+ Ac internal). D, The I–V relationship for the peak current is not significantly different for K+ Ac internal and control K+ Cl internal (n = 4–6; *p < 0.05, two-way ANOVA). The steady-state current is reduced by K+ Ac internal. The pipette solution (internal solution) contained either 120 mm Ac plus 2 mm Cl (K+ Ac internal) or 122 mm Cl (K+ Cl internal). E, AMPH (10 μm) was applied for 100 ms with a paired-pulse protocol at a variable interval to monitor recovery from desensitization in the presence of K+ Ac internal. F, A paired-pulse protocol with 90 mm Na+ Ac internal (90 mm Na+, 30 mm K+, 120 mm Ac, 2 mm Cl). G, The normalized peak current is plotted as a function of time between AMPH applications to evaluate the recovery time from desensitization (n = 4). H, The fitted paired-pulse recovery time is shown for the indicated intracellular concentrations of Na+ and Cl (n = 4–9).
Figure 9.
Figure 9.
An explicit alternating access model fit to the hDAT currents can recapitulate major features of experimental data. A, Alternating access model of hDAT function (rate constants are given for the rates at 0 mV) (see Materials and Methods). The kinetic parameters shown were used to fit the data for B–H as described below. In each case, the model simulation (color) is superimposed on the experimental data (gray). B, hDAT currents at −60 mV in response to a 1 s application of 10 μm AMPH under control conditions were normalized, aligned to the time of the peak, and averaged among cells (n = 49). C, Mean pooled experimental data for representative cells (n = 4) and model simulations for a 1 s application of 10 μm AMPH in the presence of 90 mm intracellular Na+. D, For control conditions, paired-pulse responses to 100 ms applications of 10 μm AMPH at a variable interval were normalized, aligned, and averaged among cells and compared with model simulations (n = 5). E, Mean pooled experimental data for representative cells (n = 3) and model simulations for paired-pulse responses to 100 ms applications of 10 μm AMPH in the presence of 90 mm intracellular Na+. F, Experimental and simulated dose–response relationship for AMPH-induced peak (squares) and steady-state currents (circles). G, Experimental and simulated dose–response relationship of AMPH-induced peak (squares) and steady-state currents (circles) as a function of extracellular Na+. H, Experimental and simulated voltage dependence of AMPH-induced peak (squares) and steady-state (circles) currents for the indicated internal solutions. Currents are normalized to the peak value at −60 mV.
Figure 10.
Figure 10.
An explicit alternating access model can account for the regulation of AMPH-induced currents by Cl. The model simulation (color) is superimposed on the experimental data (gray). A, hDAT currents at −60 mV in response to a 1 s application of 10 μm AMPH with control (K+Cl) internal solution were normalized, aligned to the time of the peak, and averaged among cells (n = 3). External Cl was substituted by Ac to reduce [Cl] to 15 mm. B, C, Mean pooled experimental data for representative cells (n = 4) and model simulations for paired-pulse responses to 100 ms applications of 10 μm AMPH at a variable interval. The external solution was Na+Cl. The internal solution was 90 mm Na+ Ac (90 mm Na+, 30 mm K+, 120 mm Ac, 2 mm Cl) or K+ Ac (120 mm K+, 120 mm Ac, 2 mm Cl).

References

    1. Amara SG, Kuhar MJ. Neurotransmitter transporters: recent progress. Annu Rev Neurosci. 1993;16:73–93. - PubMed
    1. Aubrey KR, Vandenberg RJ, Clements JD. Dynamics of forward and reverse transport by the glial glycine transporter, glyt1b. Biophys J. 2005;89:1657–1668. - PMC - PubMed
    1. Bergles DE, Dzubay JA, Jahr CE. Glutamate transporter currents in bergmann glial cells follow the time course of extrasynaptic glutamate. Proc Natl Acad Sci USA. 1997;94:14821–14825. - PMC - PubMed
    1. Bergles DE, Tzingounis AV, Jahr CE. Comparison of coupled and uncoupled currents during glutamate uptake by GLT-1 transporters. J Neurosci. 2002;22:10153–10162. - PMC - PubMed
    1. Bicho A, Grewer C. Rapid substrate-induced charge movements of the GABA transporter GAT1. Biophys J. 2005;89:211–231. - PMC - PubMed

Publication types

MeSH terms

Substances

LinkOut - more resources