. 2008 Feb 5;105(5):1511-5.
doi: 10.1073/pnas.0711533105. Epub 2008 Jan 23.

Structure of the transmembrane regions of a bacterial cyclic nucleotide-regulated channel

Affiliations

Structure of the transmembrane regions of a bacterial cyclic nucleotide-regulated channel

Gina M Clayton et al. Proc Natl Acad Sci U S A. .

Abstract

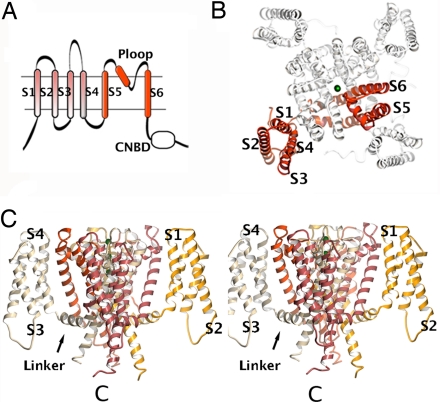
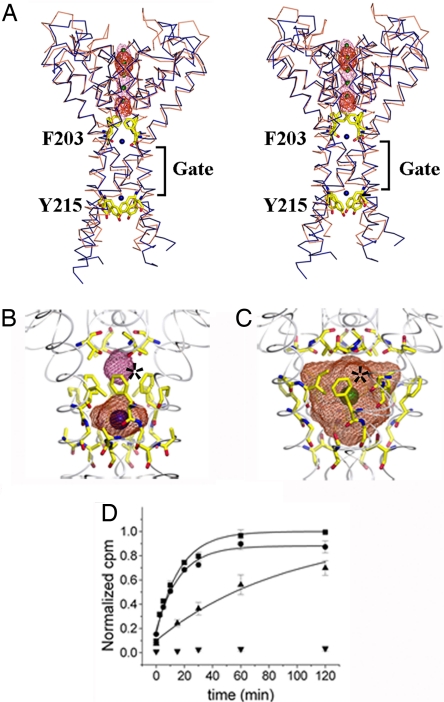
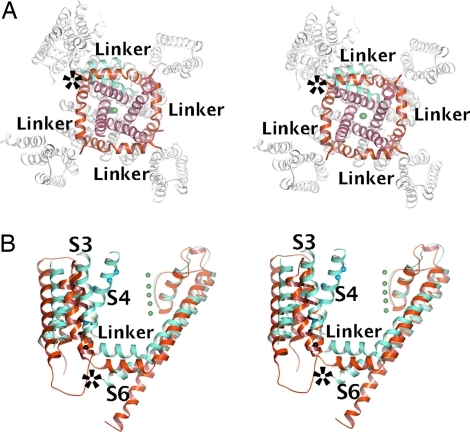
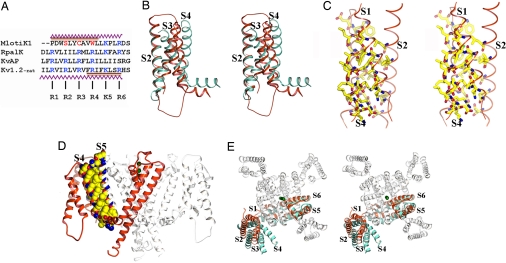
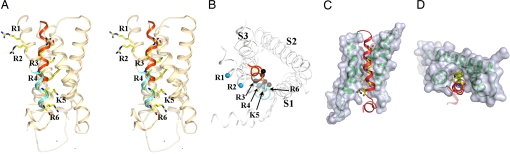
The six-transmembrane helix (6 TM) tetrameric cation channels form the largest ion channel family, some members of which are voltage-gated and others are not. There are no reported channel structures to match the wealth of functional data on the non-voltage-gated members. We determined the structure of the transmembrane regions of the bacterial cyclic nucleotide-regulated channel MlotiK1, a non-voltage-gated 6 TM channel. The structure showed how the S1-S4 domain and its associated linker can serve as a clamp to constrain the gate of the pore and possibly function in concert with ligand-binding domains to regulate the opening of the pore. The structure also led us to hypothesize a new mechanism by which motions of the S6 inner helices can gate the ion conduction pathway at a position along the pore closer to the selectivity filter than the canonical helix bundle crossing.


Conflict of interest statement

The authors declare no conflict of interest.

Figures

Fig. 1.
Fig. 1.
Architecture of 6 TM channel. (A) Illustration of a 6 TM channel. The ion pore regions (S5, Ploop, and S6) are shown in red. Also shown are the S1–S4 domain and a C-terminal cytoplasmic domain [CNB domain (CNBD)]. (B) MlotiK1 structure viewed from the extracellular side. One subunit is shown in red. TMs are labeled S1 to S6. Green spheres in the pore are K+. (C) Stereo side view of the MlotiK1 channel structure. Extracellular side at the top of figure. Subunits are shown in different colors. Some of the TMs and the S4–S5 linker are labeled. One of the C termini is indicated by C.
Fig. 2.
Fig. 2.
The pore domain. (A) Stereoview of MlotiK1 (blue) and KcsA (brown) pores. TMs S1–S5 are not shown. Phe-203 and Tyr-215 shown as yellow sticks. The difference electron-density maps are shown in red (Cs+) and pink (Rb+) mesh. K+ is shown as green spheres. Water molecules are shown as blue spheres. The bundle crossing gate region is indicated. (B) MlotiK1 cavities. Water-accessible volumes are shown as mesh. Residues lining the cavity are shown as sticks. The asterisk marks the Phe-203 side chains. Water molecules are shown as blue spheres. (C) KcsA cavity as in B. The green sphere represents K+. The asterisk indicates Phe-103 side chains. (D) Time course of MlotiK1 activity as monitored by 86Rb+ flux assay. Wild types and mutants, F203A and Y215A, were assayed for activity in the presence of saturating cAMP. The points and error bars show mean and SD for three measurements. The data were fit to the single exponential, and the time constants were determined: F203A, 16.7 ± 1.8 min; Y215A, 24.6 ± 3.8 min; wild type, 94.4 ± 9.7 min. Triangles, wild type; squares, F203A; circles, Y215A; inverted triangle, control (liposomes without protein).
Fig. 3.
Fig. 3.
The S4–S5 linker and channel gate. (A) Stereoview of cytoplasmic side of MlotiK1 channel with the Kv1.2 subunit superposed via the pore region. In MlotiK1, the S4–S5 linkers and S5 helices are colored red, whereas the C-terminal end of S6 helices is purple. In Kv1.2, the S4–S5 linker, S5, and S6 are colored cyan. The rest of the molecules are colored white. The green spheres represent K+. The asterisk indicates steric clash between the S6 of Kv1.2 and the S4–S5 linker of MlotiK1. (B) Stereo side view of MlotiK1 (red) and Kv1.2 (cyan) subunits superposed via the pore region. The S4–S5 linker and some TMs are labeled. The asterisk indicates steric clash between the S4–S5 linker of MlotiK1 and the S6 of Kv1.2.
Fig. 4.
Fig. 4.
The S1–S4 domain. (A) Structure-based sequence alignment of S4 regions from the MlotiK1 (GI:14023393), RpalK (GI:39937293), KvAP (GI:30749950), and Kv1.2 (GI:73536154) channels. Conserved positively charged residues are shown in blue. MlotiK1 residues corresponding to R2, R3, and R4 are shown in red. The zigzag lines indicate residues in the S4 helices of MlotiK1 and Kv1.2. The brown bar indicates regions of S4 adopting 310 conformation in MlotiK1 and Kv1.2. (B) Stereoview of superposition of S1–S4 domains from MlotiK1 (red) and Kv1.2 (cyan) via S2 and S1. TMs are labeled. (C) Stereoview of residues within the core of S1–S4 domain. TMs are labeled. (D) Side view of MlotiK1. The extracellular side of the membrane is above the molecule. One subunit is shown in red. The residues involved in the interaction between S4 and S5 are shown in Corey–Pauling–Koltun representation. (E) Stereoview from the extracellular side. The MlotiK1 channel (in white and red) and a Kv1.2 subunit (in cyan) are superposed via the pore region. TMs are labeled. The green spheres represent K+.
Fig. 5.
Fig. 5.
The S4 helix. (A) Stereo side view of MlotiK1 and Kv1.2 S1–S4 domains superposed via S2 and S1. 310 regions in S4 of MlotiK1 and Kv1.2 are shown in red and cyan, respectively. Other TMs are represented by brown ribbons. S4 residues discussed in the text are labeled. (B) Extracellular view of S1–S4 domains from MlotiK1 and Kv1.2 superposed via S2 and S1. 310 regions in S4 as in A. Other helical regions are in white ribbons. Kv1.2 R1, R2, R3, R4, K5, and R6 and equivalent MlotiK1 Cα atoms are shown as blue and black spheres, respectively. (C) Surface representation of MlotiK1 S1–S4 domain. S4 is shown as a red ribbon, with residues equivalent to R2, R3, R4, K5, and R6 shown as sticks. Protein regions from S1 to S3 are shown as gray surface representations. S1, S2, and S3 helices are shown as green ribbons inside the surface. (D) Same as in C but viewed from the extracellular side.

References

    1. Hille B. Ion Channels of Excitable Membranes. Sunderland, MA: Sinauer; 2001.
    1. Jan LY, Jan YN. Tracing the roots of ion channels. Cell. 1992;69:715–718. - PubMed
    1. Sigworth FJ. Voltage gating of ion channels. Q Rev Biophys. 1994;27:1–40. - PubMed
    1. Aggarwal SK, MacKinnon R. Contribution of the S4 segment to gating charge in the Shaker K+ channel. Neuron. 1996;16:1169–1177. - PubMed
    1. Seoh SA, Sigg D, Papazian DM, Bezanilla F. Voltage-sensing residues in the S2 and S4 segments of the Shaker K+ channel. Neuron. 1996;16:1159–1167. - PubMed

Publication types

MeSH terms

Substances

Associated data