

A PAI-1 mutant, PAI-1R, slows progression of diabetic nephropathy
- PMID: 18216319
- PMCID: PMC2396741
- DOI: 10.1681/ASN.2007040510
A PAI-1 mutant, PAI-1R, slows progression of diabetic nephropathy
Abstract
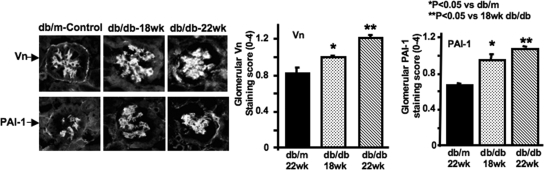
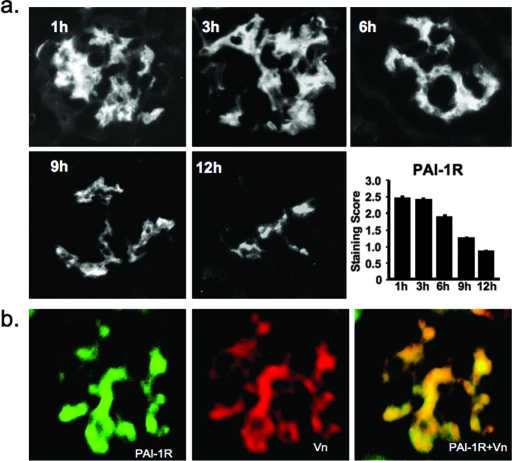
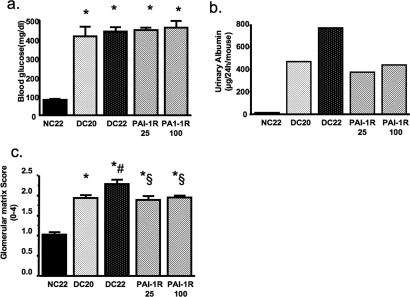
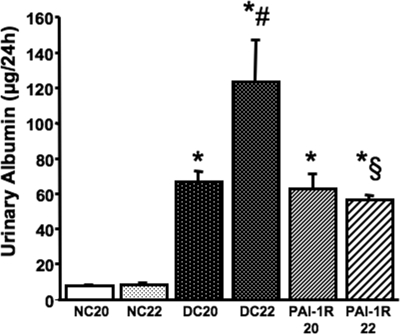
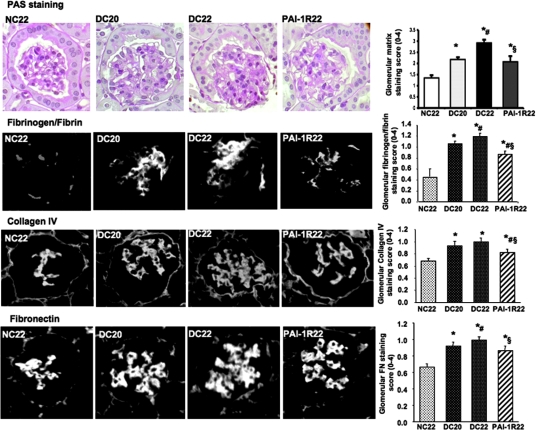
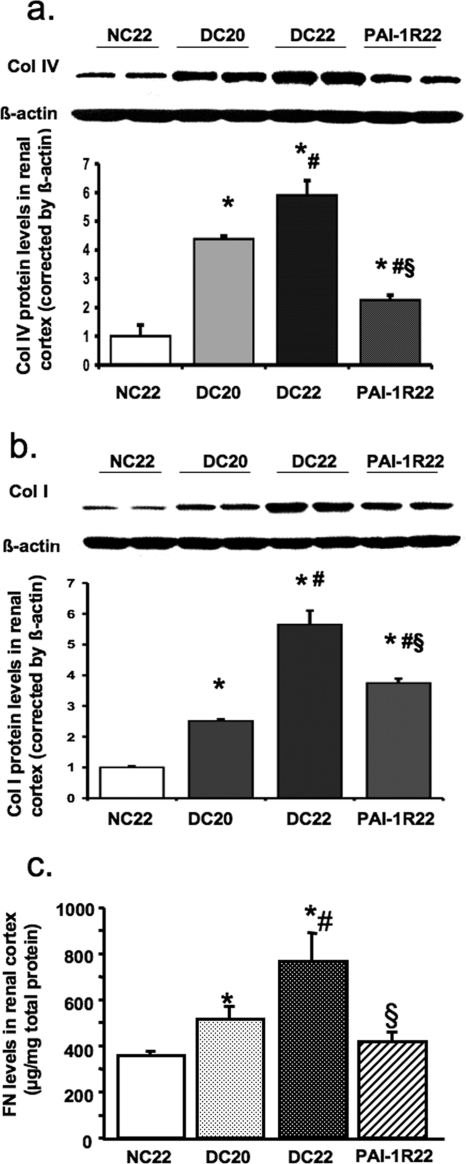
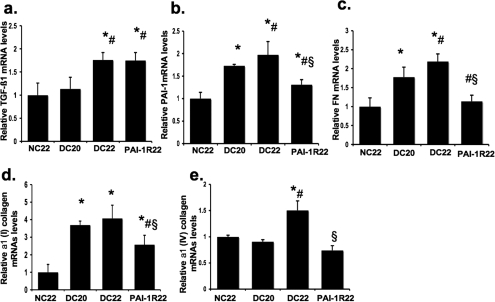
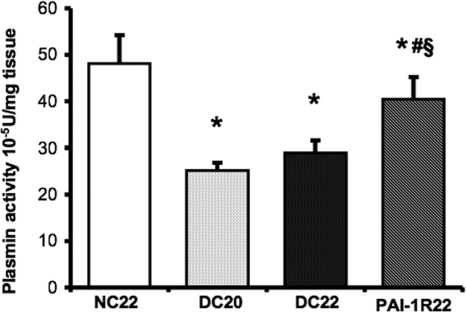
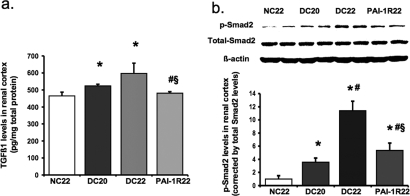
Plasminogen activator inhibitor-1 (PAI-1) has been implicated in renal fibrosis. In vitro, PAI-1 inhibits plasmin generation, and this decreases mesangial extracellular matrix turnover. PAI-1R, a mutant PAI-1, increases glomerular plasmin generation, reverses PAI-1 inhibition of matrix degradation, and reduces disease in experimental glomerulonephritis. This study sought to determine whether short-term administration of PAI-1R could slow the progression of glomerulosclerosis in the db/db mouse, a model of type 2 diabetes in which mesangial matrix accumulation is evident by 20 wk of age. Untreated uninephrectomized db/db mice developed progressive albuminuria and mesangial matrix expansion between weeks 20 and 22, associated with increased renal mRNA encoding alpha1(I) and (IV) collagens and fibronectin. Treatment with PAI-1R prevented these changes without affecting body weight, blood glucose, glycosylated hemoglobin, creatinine, or creatinine clearance; therefore, PAI-1R may prevent progression of glomerulosclerosis in type 2 diabetes.
Figures
Similar articles
-
Valsartan slows the progression of diabetic nephropathy in db/db mice via a reduction in podocyte injury, and renal oxidative stress and inflammation.Clin Sci (Lond). 2014 May;126(10):707-20. doi: 10.1042/CS20130223. Clin Sci (Lond). 2014. PMID: 24195695
-
Noninhibitory PAI-1 enhances plasmin-mediated matrix degradation both in vitro and in experimental nephritis.Kidney Int. 2006 Aug;70(3):515-22. doi: 10.1038/sj.ki.5000353. Epub 2006 Jun 21. Kidney Int. 2006. PMID: 16788698
-
An additive effect of anti-PAI-1 antibody to ACE inhibitor on slowing the progression of diabetic kidney disease.Am J Physiol Renal Physiol. 2016 Nov 1;311(5):F852-F863. doi: 10.1152/ajprenal.00564.2015. Epub 2016 Aug 10. Am J Physiol Renal Physiol. 2016. PMID: 27511457 Free PMC article.
-
Plasminogen activator inhibitor-1 in kidney pathology (Review).Int J Mol Med. 2013 Mar;31(3):503-10. doi: 10.3892/ijmm.2013.1234. Epub 2013 Jan 10. Int J Mol Med. 2013. PMID: 23314920 Review.
-
Plasminogen activator inhibitor-1 and diabetic nephropathy.Nephrology (Carlton). 2005 Oct;10 Suppl:S11-3. doi: 10.1111/j.1440-1797.2005.00449.x. Nephrology (Carlton). 2005. PMID: 16174279 Review.
Cited by
-
Stress-induced RNA-chromatin interactions promote endothelial dysfunction.Nat Commun. 2020 Oct 15;11(1):5211. doi: 10.1038/s41467-020-18957-w. Nat Commun. 2020. PMID: 33060583 Free PMC article.
-
An additive effect of eplerenone to ACE inhibitor on slowing the progression of diabetic nephropathy in the db/db mice.Am J Transl Res. 2016 Mar 15;8(3):1339-54. eCollection 2016. Am J Transl Res. 2016. PMID: 27186263 Free PMC article.
-
Sustained Klotho delivery reduces serum phosphate in a model of diabetic nephropathy.J Appl Physiol (1985). 2019 Apr 1;126(4):854-862. doi: 10.1152/japplphysiol.00838.2018. Epub 2019 Jan 3. J Appl Physiol (1985). 2019. PMID: 30605400 Free PMC article.
-
New pharmacological treatments for improving renal outcomes in diabetes.Nat Rev Nephrol. 2010 Jun;6(6):371-80. doi: 10.1038/nrneph.2010.57. Epub 2010 May 4. Nat Rev Nephrol. 2010. PMID: 20440278 Review.
-
Infusion of angiotensin-(1-7) reduces glomerulosclerosis through counteracting angiotensin II in experimental glomerulonephritis.Am J Physiol Renal Physiol. 2010 Mar;298(3):F579-88. doi: 10.1152/ajprenal.00548.2009. Epub 2009 Dec 23. Am J Physiol Renal Physiol. 2010. PMID: 20032116 Free PMC article.
References
-
- Steffes MW, Osterby R, Chavers B, Mauer SM: Mesangial expansion as a central mechanism for loss of kidney function in diabetic patients. Diabetes 38: 1077–1081, 1989 - PubMed
-
- Osterby R, Parving HH, Hommel E, Jorgensen HE, Lokkegaard H: Glomerular structure and function in diabetic nephropathy: Early to advanced stages. Diabetes 39: 1057–1063, 1990 - PubMed
-
- Schnaper HW: Balance between matrix synthesis and degradation: A determinant of glomerulosclerosis. Pediatr Nephrol 9: 104–111, 1995 - PubMed
-
- Mignatti P: Extracellular matrix remodeling by metalloproteinases and plasminogen activators. Kidney Int 47: S12–S14, 1995 - PubMed
Publication types
MeSH terms
Substances
Grants and funding
LinkOut - more resources
Full Text Sources
Medical
Molecular Biology Databases
Miscellaneous
