. 2008 Feb;19(2):233-42.
doi: 10.1681/ASN.2007040484. Epub 2008 Jan 23.

Latent TGF-beta1 protects against crescentic glomerulonephritis

Affiliations

Latent TGF-beta1 protects against crescentic glomerulonephritis

Xiao R Huang et al. J Am Soc Nephrol. 2008 Feb.

Abstract

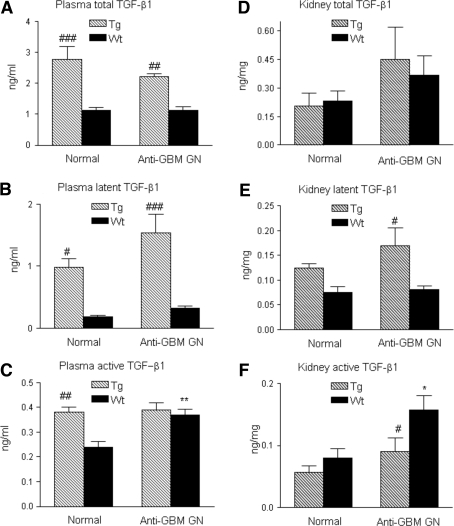
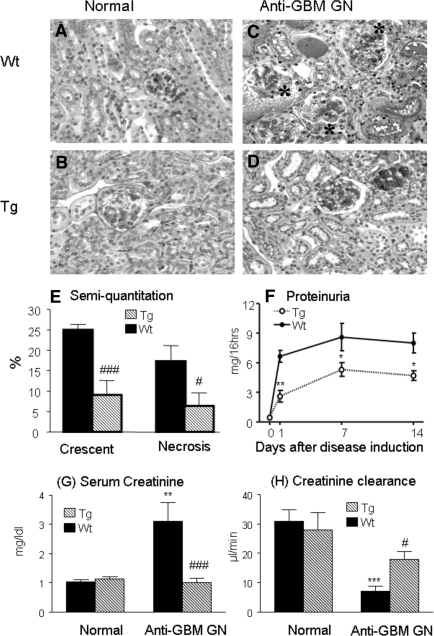
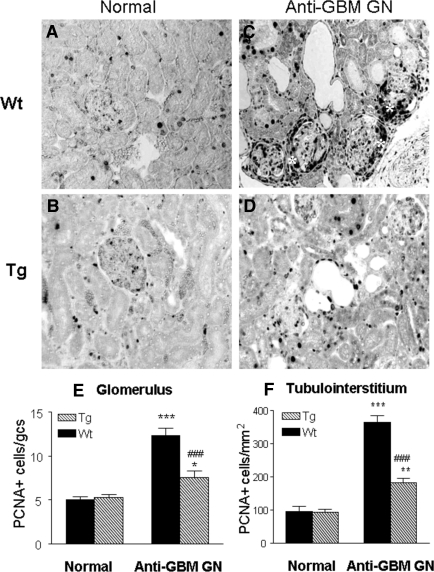
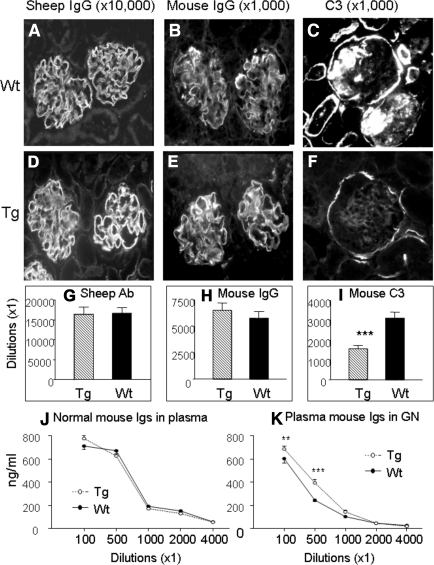
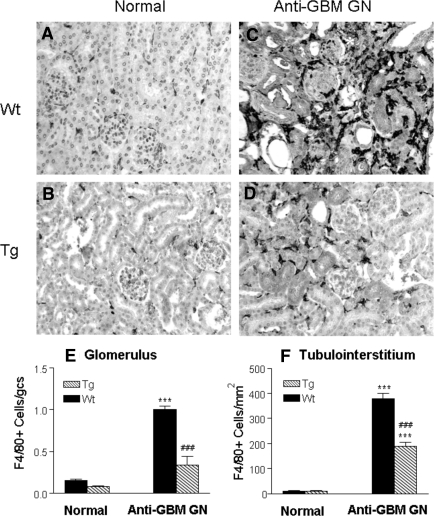
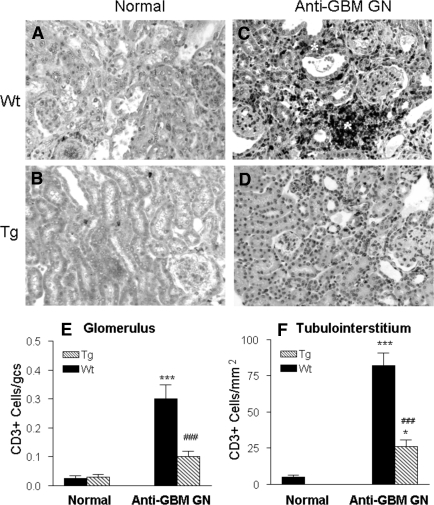
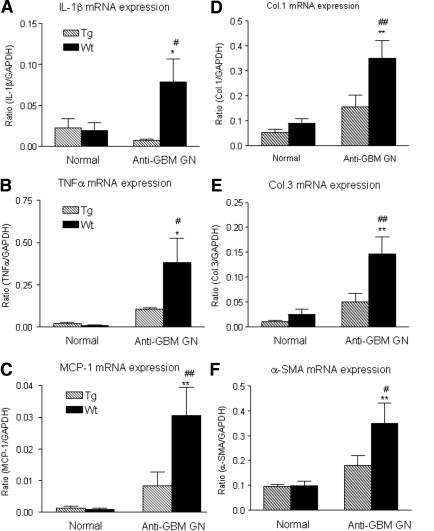
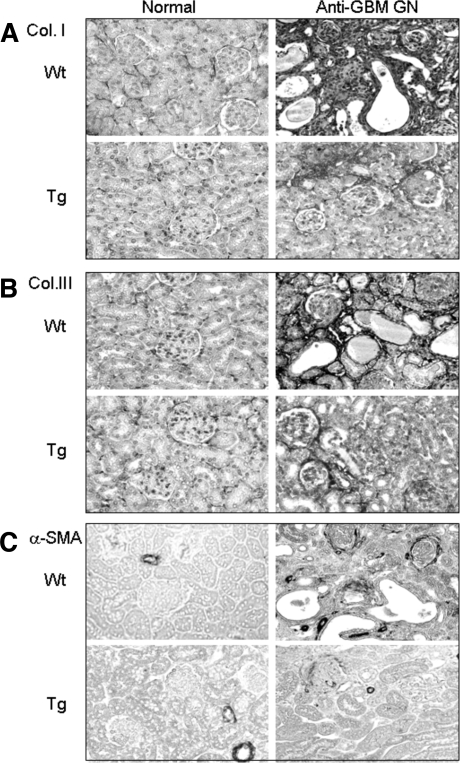
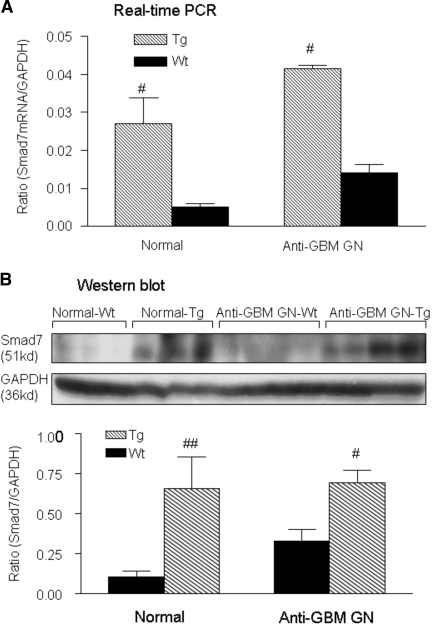
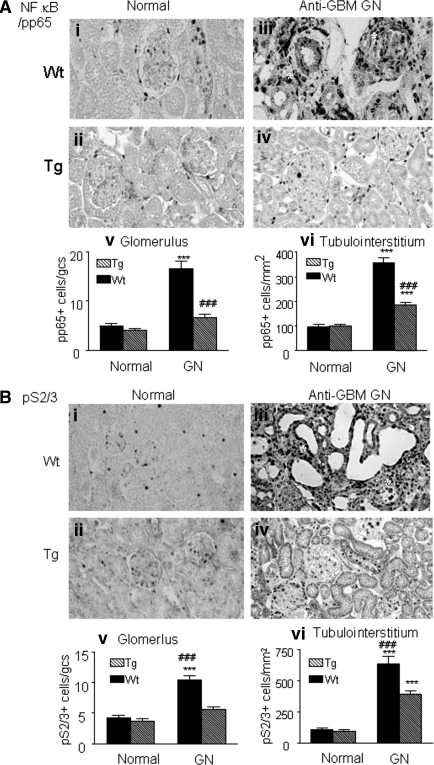
Despite the critical role that TGF-beta plays in renal fibrosis, transgenic mice that overexpress human latent TGF-beta1 in the skin exhibit normal renal histology and function even though circulating levels of latent TGF-beta1 are an order of magnitude higher than wild-type animals. In fact, latent TGF-beta1 seems to protect against renal inflammation in a model of ureteral obstruction. It is unknown, however, whether latent TGF-beta1 also has this effect in immunologically mediated forms of renal disease such as anti-GBM crescentic glomerulonephritis. We induced anti-GBM disease in wild-type and transgenic mice overexpressing latent TGF-beta1 in keratinocytes. After 14 days, wild-type mice developed progressive crescentic glomerulonephritis with severe renal inflammation and fibrosis. In transgenic mice, proteinuria was reduced by 50%, renal function was preserved, and the formation of glomerular crescents was suppressed by 70%. In addition, transgenic animals had reduced renal inflammation, evidenced by a 70% decrease in the accumulation of T cells and macrophages, and reduced expression of renal IL-1beta, TNFalpha, and MCP-1 by 70 to 80%. Progressive renal fibrosis was also prevented in the transgenic mice, and these protective effects were associated with elevated levels of latent, but not active, TGF-beta1 in plasma and renal tissue. Renal Smad7 was up-regulated and both NF-kappaB and TGF-beta/Smad2/3 activation were suppressed. In conclusion, mice overexpressing latent TGF-beta1 in the skin were protected against anti-GBM crescentic glomerulonephritis, possibly via Smad 7-mediated inhibition of NF-kappaB-dependent renal inflammation and TGF-beta/Smad2/3-dependent fibrosis.


Figures

Figure 1.
Figure 1.
Circulating levels of TGF-β1 in plasma and renal tissues in normal and anti-glomerular basement membrane (GBM) GN animals. (A) Circulating levels of total TGFβ1; (B) circulating levels of latent TGF-β1; (C) circulating levels of active TGFβ1; (D) levels of total TGFβ1 in renal tissues; (E) levels of latent TGF-β1 in renal tissues; (F) levels of active TGFβ1 in renal tissues. Each bar represents the mean ± SEM for groups of six to eight mice. *P < 0.05, **P < 0.01 compared with the normal Wt mice; #P < 0.05, ##P < 0.01, ###P < 0.001 compared with the Wt mice.
Figure 2.
Figure 2.
TGF-β1 Tg mice are protected against crescentic GN in a model of anti-GBM GN. (A, B) Kidneys from both K5.TGFβ1wt transgenic (Tg) and wild type (Wt) mice show normal renal histology. (C) A representative kidney from a Wt mouse with anti-GBM GN shows severe glomerular crescentic formation (*), segmental glomerular necrosis, and tubulointerstitial damage with numerous mononuclear cell infiltration at day 14 after induction of disease. (D) A representative kidney from a Tg mouse shows relatively normal histology at day 14 after induction of disease. (E) Semiquantitative analysis of histology. (F) Urinary protein concentrations. (G) Plasma creatinine. (H) Creatinine clearance. Each bar represents the mean ± SEM for groups of eight mice. *P < 0.05, **p <0.01, ***P < 0.001 compared with the normal mice; #P < 0.05, ###P < 0.001 compared with the Wt mice. Tissue sections are stained by periodic acid–Schiff methods. Magnification, ×200.
Figure 3.
Figure 3.
Immunohistochemistry shows that massive kidney cell proliferation [proliferating cell nuclear antigen (PCNA)+] in Wt mice with anti-GBM crescentic GN at day 14 is blocked in TGF-β1 Tg mice. Proliferating cells are identified with the anti-PCNA antibody as the nuclear staining pattern. (A, B) PCNA+ cells in normal Wt (A) and Tg (B) mice; (C, D) PCNA+ cells in the diseased kidneys in Wt (C) and Tg (D) mice; (E, F) semiquantitative analysis of PCNA+ cells within the kidney. Note that massive cell proliferation is found in the diseased kidney in Wt mice (C), contributing significantly to severe glomerular crescentic formation (*), which is prevented in Tg mice (D). Each bar represents the mean ± SEM for a group of eight mice with anti-GBM GN and six normal mice. *P < 0.05, **P < 0.01, ***P < 0.001 compared with normal mice; ###P < 0.001 when compared with the Wt mice. Magnification, ×200.
Figure 4.
Figure 4.
Effect of overexpression of latent TGF-β1 in mice with anti-GBM GN (day 14) on antibody and complement deposition and mouse Ig production. (A, D) Representative immunofluorescence staining for deposition of mouse anti-sheep IgG in Wt (A) and Tg (D) animals; (B, E) representative immunofluorescence staining for deposition of mouse IgG in Wt (B) and Tg (E) animals; (C, F) representative immunofluorescence staining for deposition of C3 in Wt (C) and Tg (F) animals. (G, H, I) Semiquantitative analysis. Note that although there is no significant difference in both sheep anti-GBM and mouse IgG deposition along GBM, deposition of C3 within the glomerulus is significantly reduced (F, I). (J, K) ELISA shows that there is no difference in plasma concentrations of mouse immunoglobulins in Wt and Tg mice, however, an increase in mouse Ig production is found in Tg. Tg mice (hatched bars), Wt mice (solid bars). Each bar represents the mean ± SEM for groups of eight mice. ***P < 0.001 compared with the Wt mice. Tissue sections are stained with serial dilutions of the antibody and semiquantitated as described in Concise Methods. Magnification, ×200.
Figure 5.
Figure 5.
Immunohistochemistry shows that macrophage infiltration within the kidney with anti-GBM crescentic GN at day 14 after disease induction is markedly inhibited in TGF-β1 Tg mice. (A, B) Normal Wt (A) and Tg (B) kidneys stained for F4/80+ T cells. (C, D) Diseased kidneys from Wt (C) and Tg (D) mice stained for F4/80+ cells. Note that extensive macrophage infiltration within the diseased kidney in Wt mice (C) contributes significantly to severe glomerular and tubulointerstitial damage, including glomerular crescentic formation (*). In contrast, macrophage infiltration within the diseased kidney is inhibited in TGF-β1 Tg mice (D). (E, F) Semiquantitative analysis. Each bar represents the mean ± SEM for a group of eight with anti-GBM GN and six normal mice. ***P < 0.001 compared with normal mice; ### P < 0.001 when compared with the Wt mice. Magnification, ×200.
Figure 6.
Figure 6.
Immunohistochemistry shows that CD3+ T cell infiltration within the kidney with anti-GBM crescentic GN at day 14 is markedly inhibited in TGF-β1 Tg mice. (A, B) Normal Wt (A) and Tg (B) kidneys stained with the anti-CD3 antibody. (C, D) Diseased kidneys from Wt (C) and Tg (D) mice stained with the anti-CD3 antibody. Note that extensive CD3+ T cell infiltration within the diseased kidney in Wt mice (C) contributes significantly to severe glomerular and tubulointerstitial damage, resulting in focal tubulointerstitial damage (*). In contrast, CD3+ T cell infiltration within the diseased kidney in Tg mice is inhibited (D). (E, F) Semiquantitative analysis. Each bar represents the mean ± SEM for a group of eight mice with anti-GBM GN and six normal mice. *P < 0.05, ***P < 0.001 compared with normal mice; ### P < 0.001 when compared with the Wt mice. Magnification, ×200.
Figure 7.
Figure 7.
Real time PCR shows renal inflammatory cytokines and chemokine (IL-1β, TNFα, and MCP-1) and extracellular matrix (collagen I, III, and α-SMA) mRNA expression in normal and anti-GBM GN (day 14) in both Wt and Tg mice. Total renal RNA extracted from normal and diseased kidney from Wt (solid bar) and Tg (hatched bar) mice were reverse transcribed and subjected to real-time PCR for IL-1β (A), TNFα (B), MCP-1 (C), collagen I (D), collagen III (E), and α-SMA (F). Each bar represents the mean ± SEM for a group of six mice. *P < 0.05, **P < 0.01 compared with the normal Wt mice. #P < 0.05, ##P < 0.01 when compared with the Wt.
Figure 8.
Figure 8.
Immunohistochemistry shows extracellular matrix (collagen I, III, and α-SMA) accumulation within the kidney in normal and anti-GBM GN (day 14) in both Wt and Tg mice. (A) Collagen I; (B) collagen III; (C) α-SMA. Note that a strong accumulation of collagen I and III and α-SMA in the areas of tubulointerstitial damage is found in Wt mice with anti-GBM GN, which is substantially inhibited in Tg mice. Each picture represents an immunohistological change for a group of six normal and eight diseased mice. Magnification, ×200.
Figure 9.
Figure 9.
Renal Smad7 is upregulated in both normal and anti-GBM disease mice that overexpress TGF-β1. (A) Real-time PCR, (B) Western blot analysis. Wt mice (solid bar), Tg mice (hatched bar), each bar represents the mean ± SEM for a group of six mice. #P < 0.05, ##P < 0.01 compared with Wt mice.
Figure 10.
Figure 10.
Immunohistochemistry shows that NF.κB/p65 and Smad2/3 activation are blocked in TGF-β1 Tg mice with anti-GBM crescentic GN at day 14. Activation of NF.κB/p65 subunits and Smad2/3 are identified with the anti-phosphorylated p65 (pp65) or p-Smad2/3 antibody as the nuclear staining pattern. (Ai and Aii) NF.κB/pp65 nuclear location in the normal Wt and Tg mice; (Aiii and Aiv) activation of NF.κB/pp65 in the diseased kidney in Wt and Tg mice; (Av and Avi) semiquantitative analysis of NF.κB/pp65. (Bi and Bii) p-Smad2/3 nuclear location in the normal Wt and Tg mice; (Biii and Biv) activation of p-Smad2/3 in the diseased kidney in Wt and Tg mice; (Bv and Bvi) semiquantitative analysis of p-Smad2/3. Note that extensive activation of NF.κB/pp65 and p-Smad2/3 contributes significantly to severe glomerular and tubulointerstitial damage, resulting in glomerular crescent formation and focal tubulointerstitial damage (*). Each bar represents the mean ± SEM for a group of eight mice with anti-GBM GN and six normal mice. ***P < 0.001 compared with normal mice; ### P < 0.001 when compared with the Wt mice. Magnification, ×200.

References

    1. Letterio JJ, Roberts AB: Regulation of immune responses by TGF-beta. Annu Rev Immunol 16: 137–161, 1998 - PubMed
    1. Roberts AB: Molecular and cell biology of TGF-beta. Miner Electrolyte Metab 24: 111–119, 1998 - PubMed
    1. Wang W, Koka V, Lan HY: Transforming growth factor-beta and Smad signaling in kidney diseases. Nephrology (Carlton) 10: 48–56, 2005 - PubMed
    1. Yaswen L, Kulkarni AB, Fredrickson T, Mittleman B, Schiffman R, Payne S, Longenecker G, Mozes E, Karlsson S: Autoimmune manifestations in the transforming growth factor-beta 1 knockout mouse. Blood 87: 1439–1445, 1996 - PubMed
    1. Chen W, Jin W, Cook M, Weiner HL, Wahl SM: Oral delivery of group A streptococcal cell walls augments circulating TGF-beta and suppresses streptococcal cell wall arthritis. J Immunol 161: 6297–6304, 1998 - PubMed

Publication types

MeSH terms

LinkOut - more resources