Comparative Study
. 2008 May;7(5):962-70.
doi: 10.1074/mcp.M700293-MCP200. Epub 2008 Jan 23.

Comparison of Mascot and X!Tandem performance for low and high accuracy mass spectrometry and the development of an adjusted Mascot threshold

Affiliations
Comparative Study

Comparison of Mascot and X!Tandem performance for low and high accuracy mass spectrometry and the development of an adjusted Mascot threshold

Markus Brosch et al. Mol Cell Proteomics. 2008 May.

Abstract

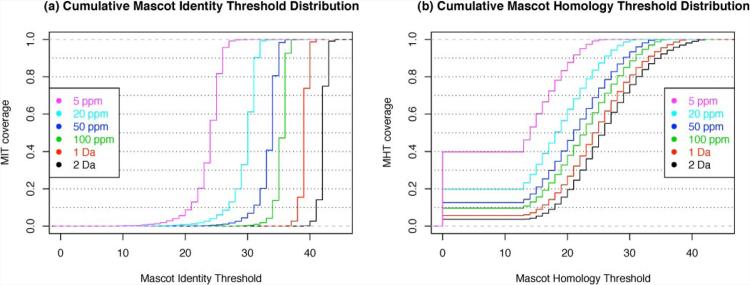
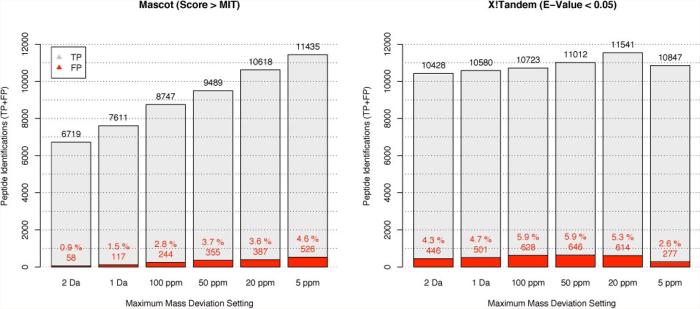
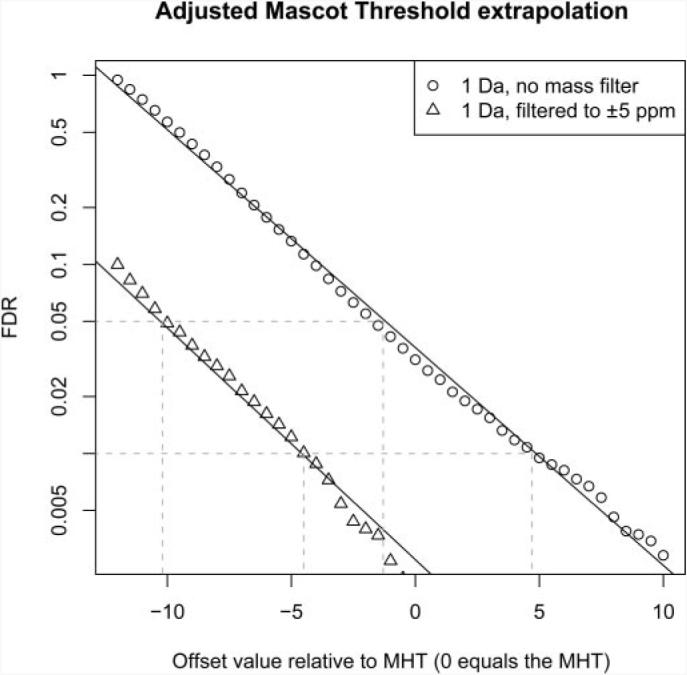
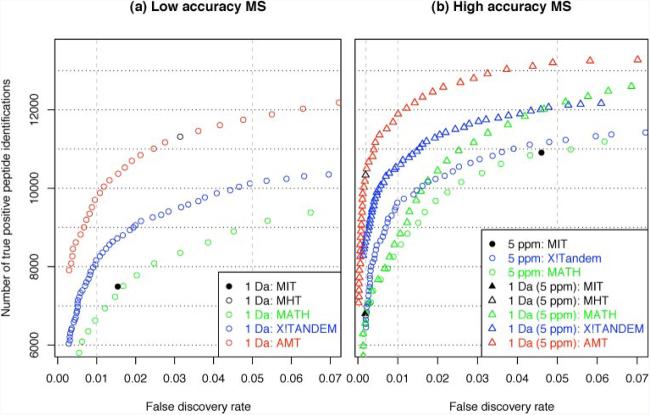
It is a major challenge to develop effective sequence database search algorithms to translate molecular weight and fragment mass information obtained from tandem mass spectrometry into high quality peptide and protein assignments. We investigated the peptide identification performance of Mascot and X!Tandem for mass tolerance settings common for low and high accuracy mass spectrometry. We demonstrated that sensitivity and specificity of peptide identification can vary substantially for different mass tolerance settings, but this effect was more significant for Mascot. We present an adjusted Mascot threshold, which allows the user to freely select the best trade-off between sensitivity and specificity. The adjusted Mascot threshold was compared with the default Mascot and X!Tandem scoring thresholds and shown to be more sensitive at the same false discovery rates for both low and high accuracy mass spectrometry data.


Figures

Fig. 1
Fig. 1
a, cumulative MIT distributions for different peptide mass tolerance settings. Only MITs from queries with a peptide assignment across all searches were used to enable comparison. With more stringent MMD settings, the MIT tends to decrease, accommodating for the smaller search space. Vice versa it increases for more relaxed MMD windows. b, cumulative MHT distributions over the range of MMD settings. The MHT is not reported for every query. All MHTs exceeding the MIT are omitted by Mascot and reported as 0 in the HTML and XML result files (J. Cottrell, personal communication). The minimum MHT reported by Mascot is 13, and the maximum MHT is limited by the corresponding MIT.
Fig. 2
Fig. 2. Comparative evaluation of Mascot and X!Tandem performance
Mascot and X!Tandem searches were performed against a target database and a decoy database at different MMD settings. The total number of identifications is reported; the estimated number of true identifications is indicated in gray, and the estimated number of incorrect assignments is highlighted in red.
Fig. 3
Fig. 3. Regression for extrapolating the AMT thresholds
Data were searched at a 1-Da MMD setting against the target and decoy databases. A range of offset values was applied that were added to the MHT and used as cutoff thresholds. For each new threshold the associated FDR was determined. A linear regression between the logarithm of the FDR and the offset values was calculated (r2 = 0.99). The method was also applied to the mass accuracy-filtered data set (5 ppm). A new adjusted Mascot threshold can be extrapolated based on a user-defined FDR for each data set. The AMT adapts for the preceding mass accuracy filtering. Moreover the regression can be used to rescore peptide-spectra matches with empirical E-values, e.g. a match that scored 4.7 above the MHT for the unfiltered data set would obtain an E-value of 10−2.
Fig. 4
Fig. 4. MIT, MHT, MATH, X!Tandem, and AMT comparison for low and high accuracy mass tolerance settings
A 1-Da search (left), a 5-ppm search (right, circles), and a 1-Da search with subsequent peptide mass accuracy filtering at 5 ppm (right, triangles) were performed. The TPs and false discovery rates were determined and represented in the receiver-operator curve, enabling the user to choose the best trade-off between sensitivity (TPs) and specificity (false discovery rate).

References

    1. Rudnick P, Wang Y, Evans E, Lee C, Balgley B. Large scale analysis of MASCOT results using a Mass Accuracy-based THreshold (MATH) effectively improves data interpretation. J. Proteome Res. 2005;4:1353–1360. - PubMed
    1. Aebersold R, Mann M. Mass spectrometry-based proteomics. Nature. 2003;422:198–207. - PubMed
    1. de Godoy L, Olsen J, de Souza G, Li G, Mortensen P, Mann M. Status of complete proteome analysis by mass spectrometry: SILAC labeled yeast as a model system. Genome Biol. 2006;7:R50. - PMC - PubMed
    1. Foster L, de Hoog C, Zhang Y, Zhang Y, Xie X, Mootha V, Mann M. A mammalian organelle map by protein correlation profiling. Cell. 2006;125:187–199. - PubMed
    1. Washburn M, Wolters D, Yates JR. Large-scale analysis of the yeast proteome by multidimensional protein identification technology. Nat. Biotechnol. 2001;19:242–247. - PubMed

Publication types

LinkOut - more resources