

The nature of letter crowding as revealed by first- and second-order classification images
- PMID: 18217820
- PMCID: PMC2635026
- DOI: 10.1167/7.2.5
The nature of letter crowding as revealed by first- and second-order classification images
Abstract
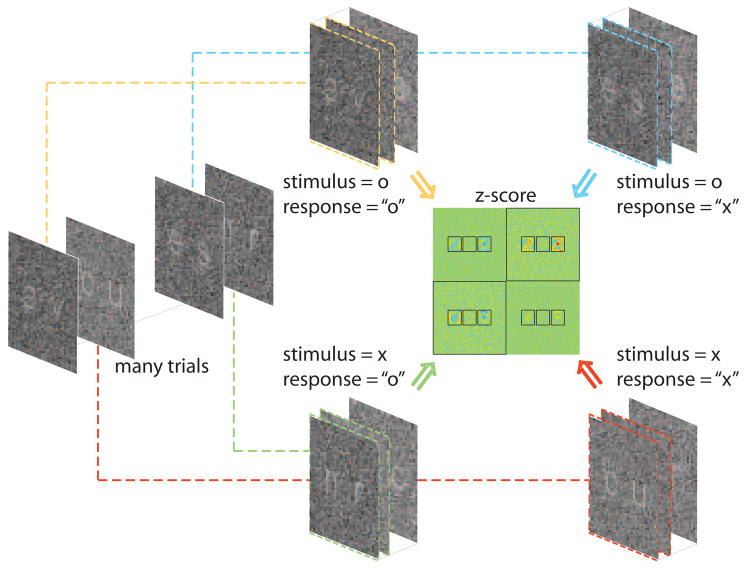
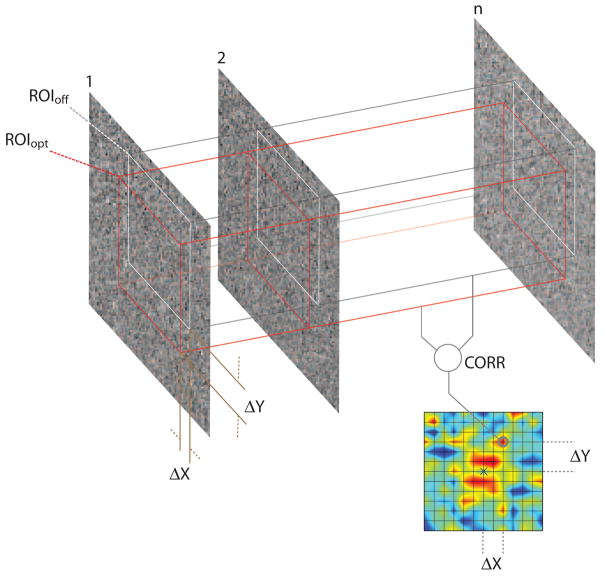
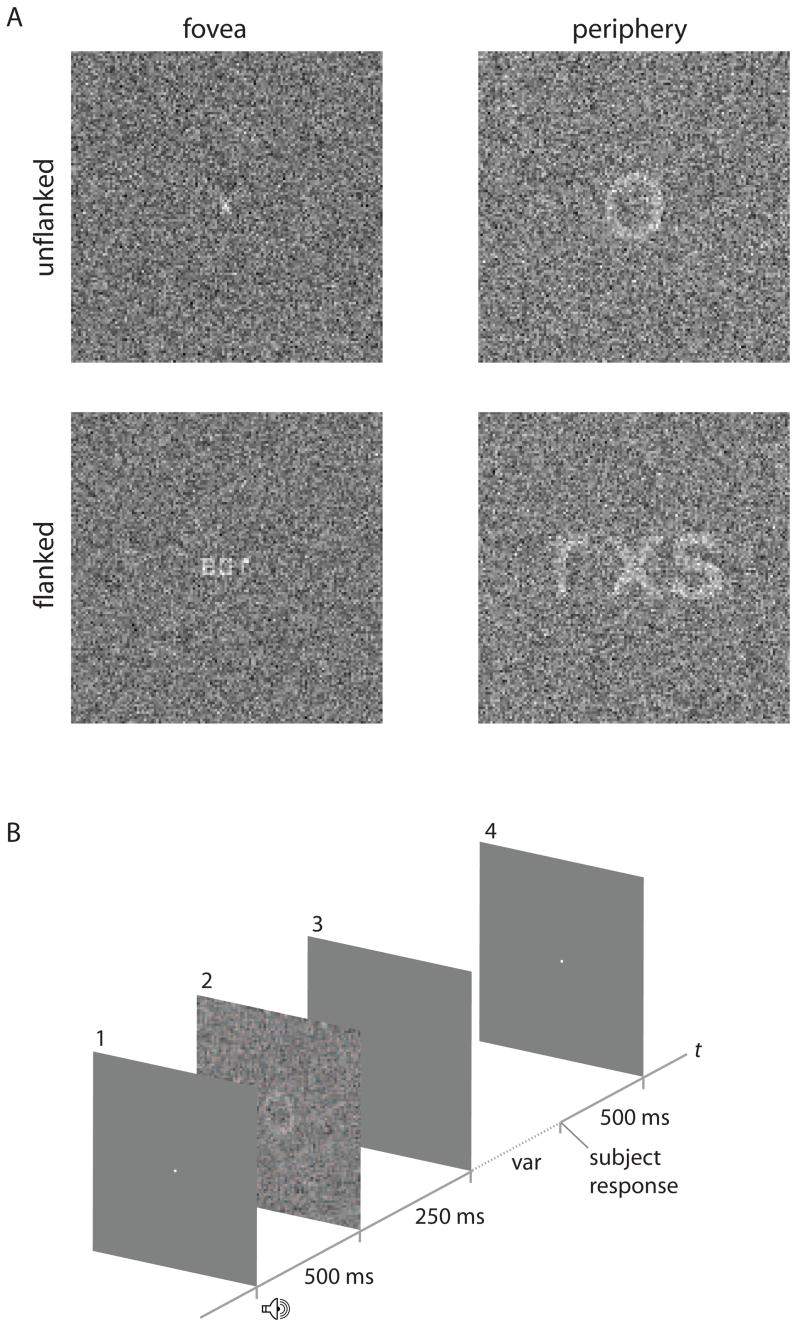
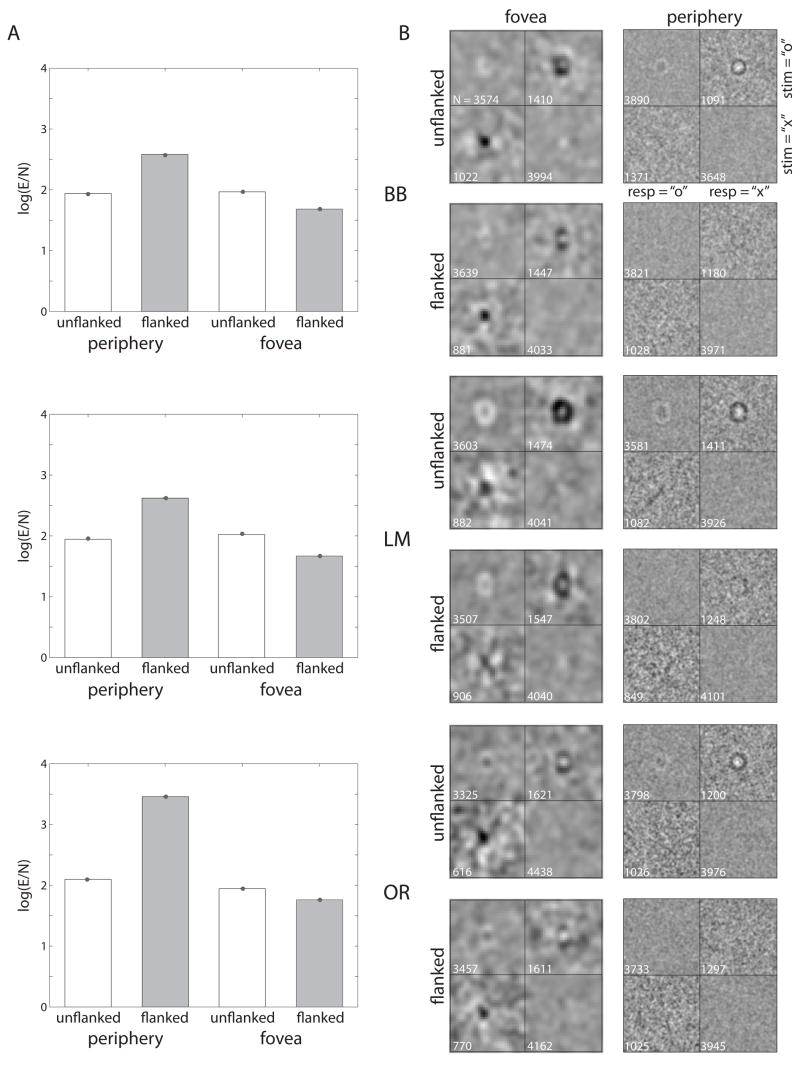
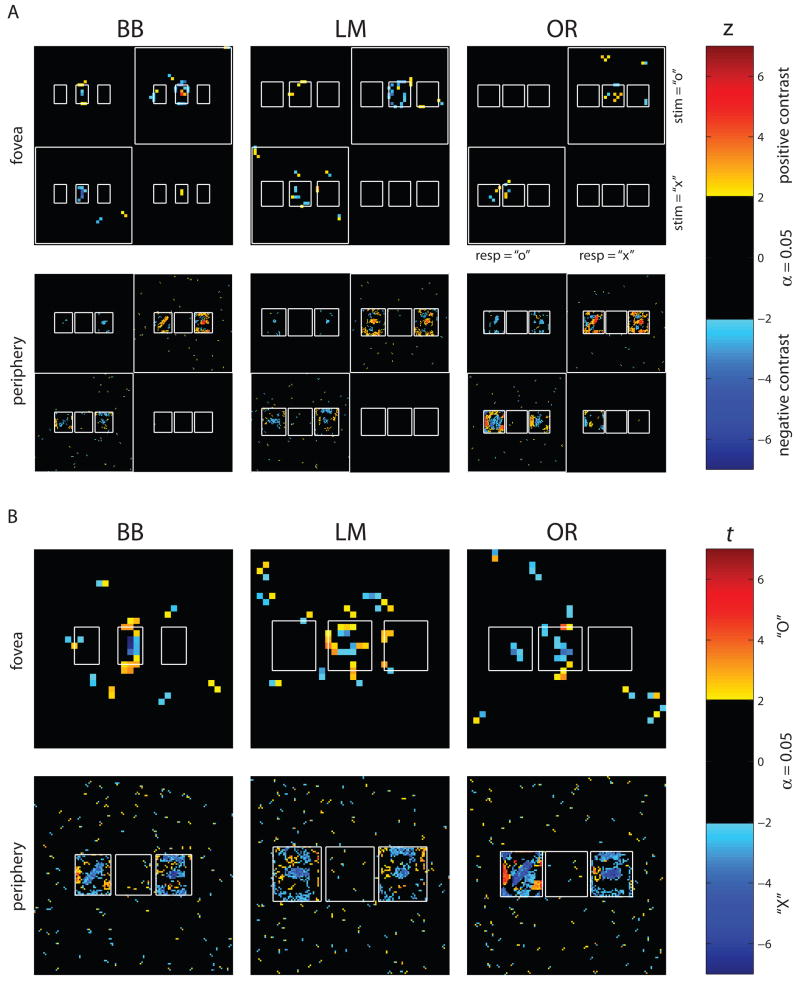
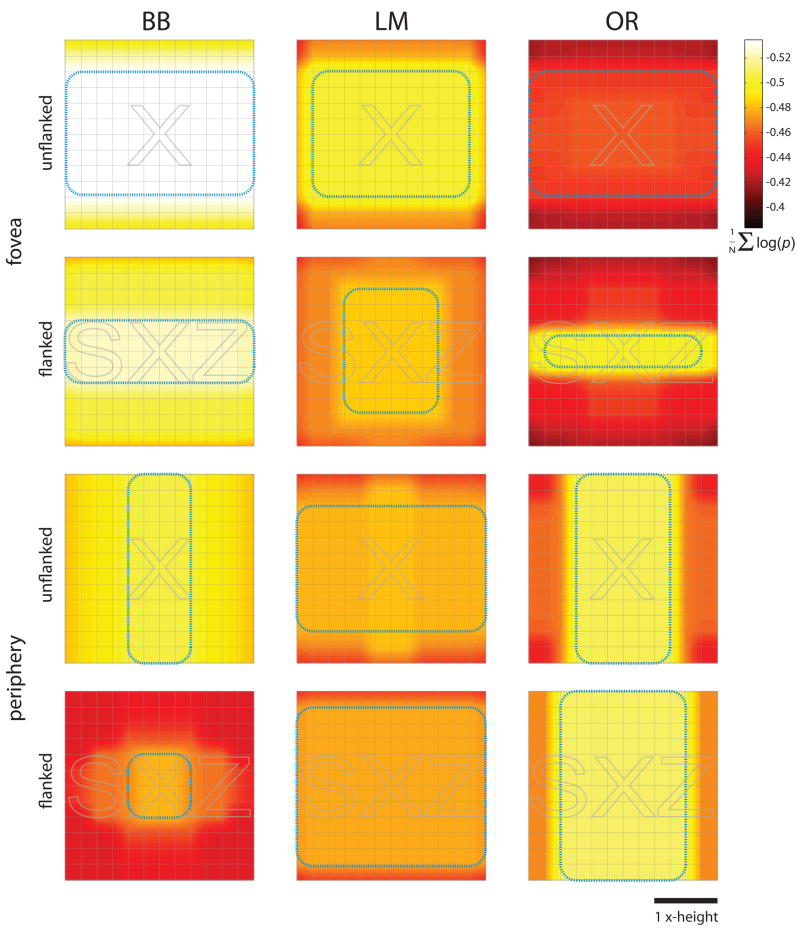
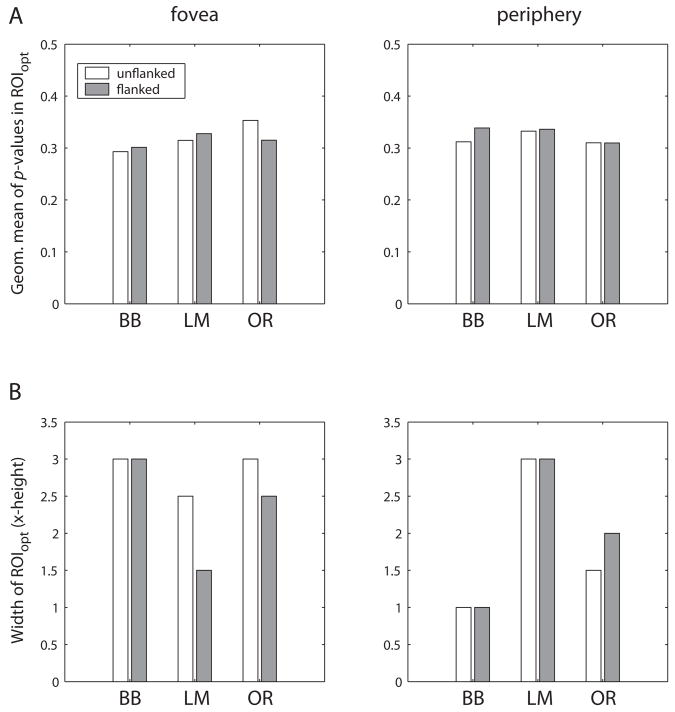
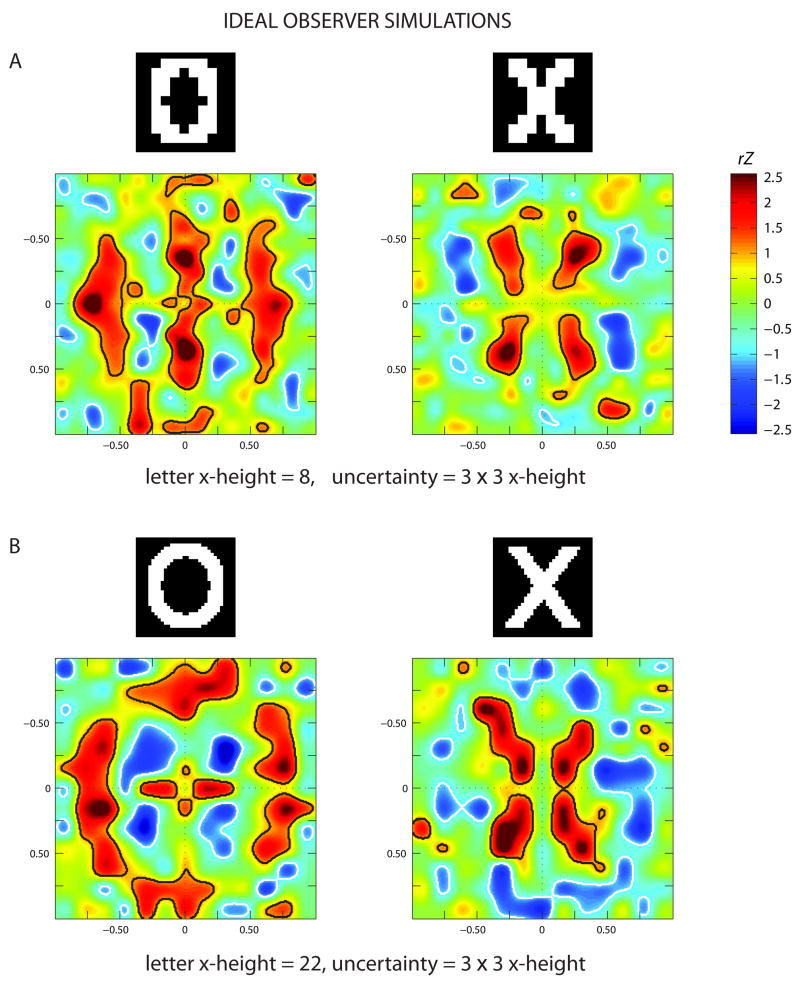
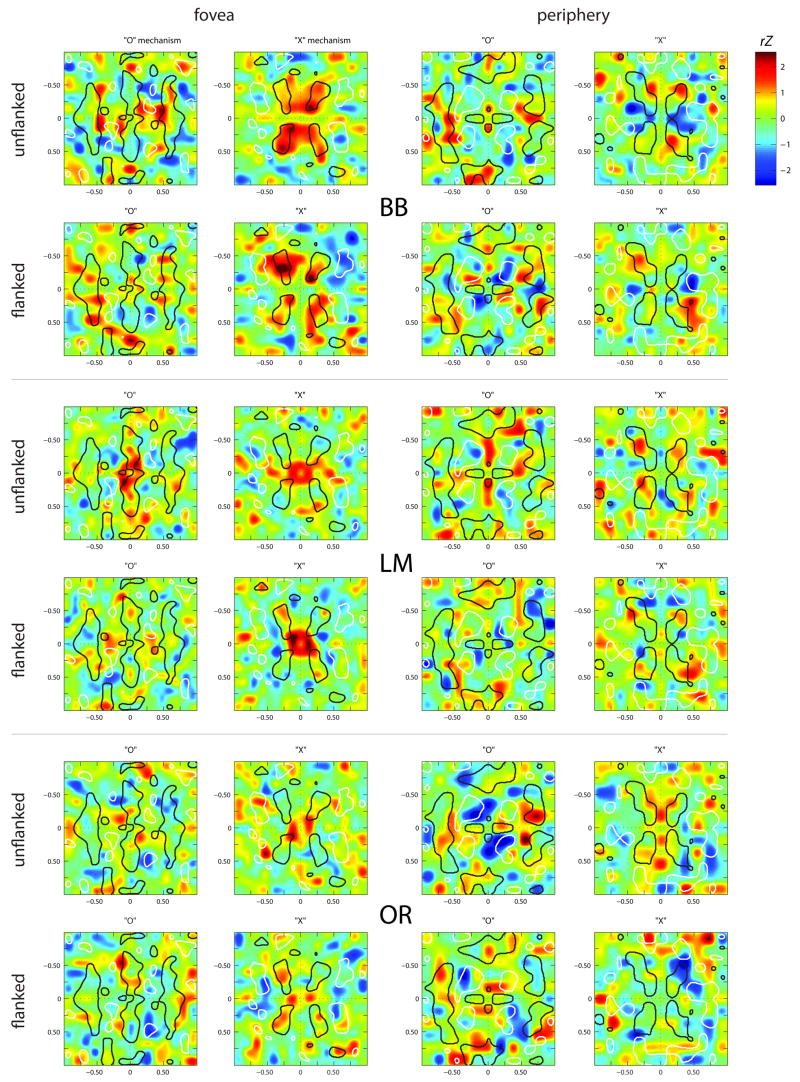
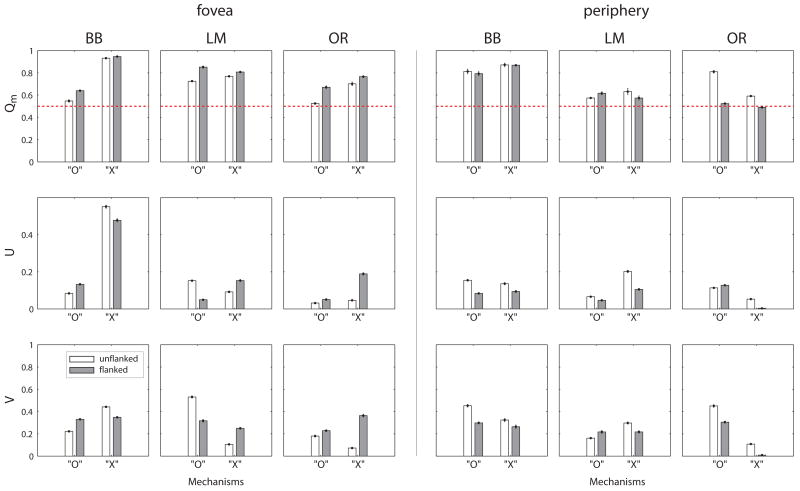
Visual crowding refers to the marked inability to identify an otherwise perfectly identifiable object when it is flanked by other objects. Crowding places a significant limit on form vision in the visual periphery; its mechanism is, however, unknown. Building on the method of signal-clamped classification images (Tjan & Nandy, 2006), we developed a series of first- and second-order classification-image techniques to investigate the nature of crowding without presupposing any model of crowding. Using an "o" versus "x" letter-identification task, we found that (1) crowding significantly reduced the contrast of first-order classification images, although it did not alter the shape of the classification images; (2) response errors during crowding were strongly correlated with the spatial structures of the flankers that resembled those of the erroneously perceived targets; (3) crowding had no systematic effect on intrinsic spatial uncertainty of an observer nor did it suppress feature detection; and (4) analysis of the second-order classification images revealed that crowding reduced the amount of valid features used by the visual system and, at the same time, increased the amount of invalid features used. Our findings strongly support the feature-mislocalization or source-confusion hypothesis as one of the proximal contributors of crowding. Our data also agree with the inappropriate feature-integration account with the requirement that feature integration be a competitive process. However, the feature-masking account and a front-end version of the spatial attention account of crowding are not supported by our data.
Figures

Similar articles
-
Efficient integration across spatial frequencies for letter identification in foveal and peripheral vision.J Vis. 2008 Oct 17;8(13):3.1-20. doi: 10.1167/8.13.3. J Vis. 2008. PMID: 19146333 Free PMC article.
-
Crowding between first- and second-order letter stimuli in normal foveal and peripheral vision.J Vis. 2007 Mar 9;7(2):10.1-13. doi: 10.1167/7.2.10. J Vis. 2007. PMID: 18217825 Free PMC article.
-
Object crowding.J Vis. 2011 May 25;11(6):10.1167/11.6.19 19. doi: 10.1167/11.6.19. J Vis. 2011. PMID: 21613388 Free PMC article.
-
Crowding and eccentricity determine reading rate.J Vis. 2007 Oct 26;7(2):20.1-36. doi: 10.1167/7.2.20. J Vis. 2007. PMID: 18217835 Review.
-
Crowding: a neuroanalytic approach.J Vis. 2007 Jul 30;7(2):16.1-9. doi: 10.1167/7.2.16. J Vis. 2007. PMID: 18217831 Review.
Cited by
-
Target Type Modulates the Effect of Task Demand on Reflexive Focal Attention.Vision (Basel). 2017 May 6;1(2):13. doi: 10.3390/vision1020013. Vision (Basel). 2017. PMID: 31740638 Free PMC article.
-
Crowding, visual awareness, and their respective neural loci.J Vis. 2017 May 1;17(5):18. doi: 10.1167/17.5.18. J Vis. 2017. PMID: 28549353 Free PMC article.
-
Efficient integration across spatial frequencies for letter identification in foveal and peripheral vision.J Vis. 2008 Oct 17;8(13):3.1-20. doi: 10.1167/8.13.3. J Vis. 2008. PMID: 19146333 Free PMC article.
-
Precision of position signals for letters.Vision Res. 2009 Jul;49(15):1948-60. doi: 10.1016/j.visres.2009.05.004. Epub 2009 May 19. Vision Res. 2009. PMID: 19460396 Free PMC article. Clinical Trial.
-
Saccade-confounded image statistics explain visual crowding.Nat Neurosci. 2012 Jan 8;15(3):463-9, S1-2. doi: 10.1038/nn.3021. Nat Neurosci. 2012. PMID: 22231425 Free PMC article.
References
-
- Adolphs R, Gosselin F, Buchanan TW, Tranel D, Schyns P, Damasio AR. A mechanism for impaired fear recognition after amygdala damage. Nature. 2005;433:68–72. - PubMed
-
- Ahumada AJ., Jr Classification image weights and internal noise level estimation. Journal of Vision. 2002. pp. 8pp. 121–131. http://journalofvisionorg/2/1/8/ - DOI - PubMed
-
- Allman J, Miezin F, McGuinness E. Stimulus specific responses from beyond the classical receptive field: Neurophysiological mechanisms for local–global comparisons in visual neurons. Annual Review of Neuroscience. 1985;8:407–430. - PubMed
-
- Beard BL, Ahumada AJ., Jr Detection in fixed and random noise in foveal and parafoveal vision explained by template learning. Journal of the Optical Society of America A, Optics, Image Science, and Vision. 1999;16:755–763. - PubMed
Publication types
MeSH terms
Grants and funding
LinkOut - more resources
Full Text Sources
