

New resampling method for evaluating stability of clusters
- PMID: 18218074
- PMCID: PMC2265265
- DOI: 10.1186/1471-2105-9-42
New resampling method for evaluating stability of clusters
Abstract
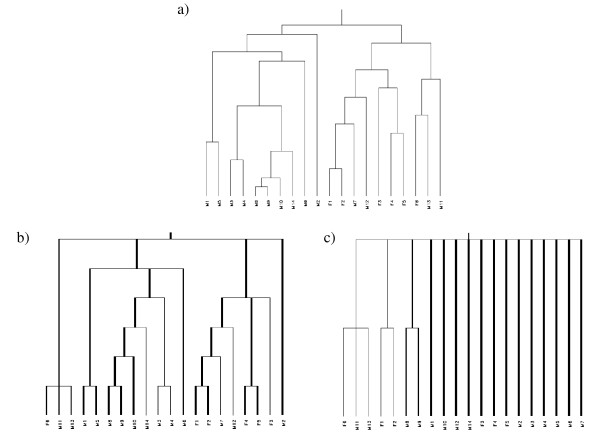
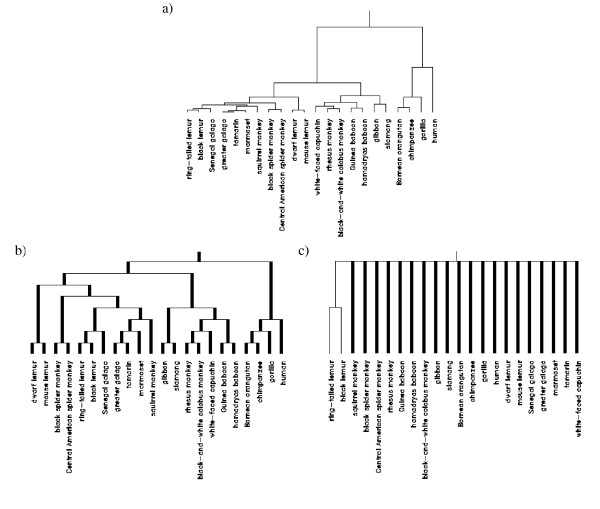
Background: Hierarchical clustering is a widely applied tool in the analysis of microarray gene expression data. The assessment of cluster stability is a major challenge in clustering procedures. Statistical methods are required to distinguish between real and random clusters. Several methods for assessing cluster stability have been published, including resampling methods such as the bootstrap. We propose a new resampling method based on continuous weights to assess the stability of clusters in hierarchical clustering. While in bootstrapping approximately one third of the original items is lost, continuous weights avoid zero elements and instead allow non integer diagonal elements, which leads to retention of the full dimensionality of space, i.e. each variable of the original data set is represented in the resampling sample.
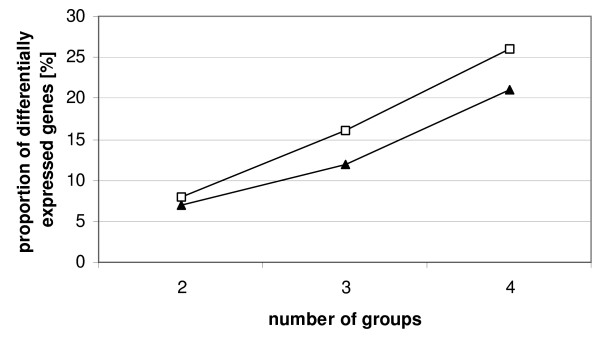
Results: Comparison of continuous weights and bootstrapping using real datasets and simulation studies reveals the advantage of continuous weights especially when the dataset has only few observations, few differentially expressed genes and the fold change of differentially expressed genes is low.
Conclusion: We recommend the use of continuous weights in small as well as in large datasets, because according to our results they produce at least the same results as conventional bootstrapping and in some cases they surpass it.
Figures


References
-
- Sørensen T. A method of establishing groups of equal amplitude in plant sociology based on similarity of species content and its application to analyses of the vegetation on Danish commons. Biologiske Skrifter. 1948;5:1–34.
-
- Sneath PHA. The application of computers to taxonomy. J Gen Microbiol. 1957;17:201–226. - PubMed
-
- Sokal RR, Michener CD. A statistical method for evaluating systematic relationships. Univ Kans Sci Bull. 1958;38:1409–1438.
-
- Ward JH. Hierarchical grouping to optimize an objective function. J Am Stat Assoc. 1963;58:236–244. doi: 10.2307/2282967. - DOI
Publication types
MeSH terms
LinkOut - more resources
Full Text Sources
