. 2008 Jan 24;9(1):R18.
doi: 10.1186/gb-2008-9-1-r18.

Evidence for horizontal transfer of a secondary metabolite gene cluster between fungi

Affiliations

Evidence for horizontal transfer of a secondary metabolite gene cluster between fungi

Nora Khaldi et al. Genome Biol. .

Abstract

Background: Filamentous fungi synthesize many secondary metabolites and are rich in genes encoding proteins involved in their biosynthesis. Genes from the same pathway are often clustered and co-expressed in particular conditions. Such secondary metabolism gene clusters evolve rapidly through multiple rearrangements, duplications and losses. It has long been suspected that clusters can be transferred horizontally between species, but few concrete examples have been described so far.

Results: In the rice blast fungus Magnaporthe grisea, the avirulence gene ACE1 that codes for a hybrid polyketide synthase-nonribosomal peptide synthetase (PKS-NRPS) belongs to a cluster of 15 genes involved in secondary metabolism. Additional related clusters were detected in the ascomycetes Chaetomium globosum, Stagonospora nodorum and Aspergillus clavatus. Gene-by-gene phylogenetic analysis showed that in C. globosum and M. grisea, the evolution of these ACE1-like clusters is characterized by successive complex duplication events including tandem duplication within the M. grisea cluster. The phylogenetic trees also present evidence that at least five of the six genes in the homologous ACE1 gene cluster in A. clavatus originated by horizontal transfer from a donor closely related to M. grisea.

Conclusion: The ACE1 cluster originally identified in M. grisea is shared by only few fungal species. Its sporadic distribution within euascomycetes is mainly explained by multiple events of duplication and losses. However, because A. clavatus contains an ACE1 cluster of only six genes, we propose that horizontal transfer from a relative of M. grisea into an ancestor of A. clavatus provides a much simpler explanation of the observed data than the alternative of multiple events of duplication and losses of parts of the cluster.


Figures

Figure 1
Figure 1
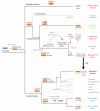
ACE1 and ACE1-like gene clusters in filamentous fungi. Colors indicate gene orthology in different species and paralogs in the same species. Horizontal lines indicate genes that are adjacent in the genome, with gene orientations as shown. Genomic regions are not drawn to scale. Parts A and B of the M. grisea cluster as identified in the text are marked. The core set of three genes inferred to have been present in the ancestral cluster are boxed. Vertical lines indicate the closest relatives of genes in the M. grisea cluster and one of the A. clavatus clusters, based on phylogenetic analyses (Figure 2 and Additional data file 1). The species phylogeny is based on the whole-genome supertree analysis of Fitzpatrick et al [27]; in that study the placement of Dothideomycetes relative to Sordariomycetes and Eurotiomycetes varied depending on the method of analysis, so we have shown it as a trichotomy. The analysis of Hane et al of the complete S. nodorum genome placed Dothideomycetes and Sordariomycetes in a clade with Eurotiomycetes outside [47]. Species-specific gene nomenclature is shown, except for M. grisea (Collemare et al, unpublished results). Red, green and blue coloring of species names corresponds to the labelling of individual genes from the clusters in Figure 2 and Additional data file 1.0.
Figure 2
Figure 2
Maximum likelihood trees for ACE1 cluster genes and their homologs. (a) ACE1 and SYN2; (b) RAP1 and RAP2; (c) CYP1 and CYP4; (d) CYP2 and CYP3; (e) ORF3; (f) ORFZ. In each tree, genes that appear in Figure 1 are named in color or bold black. Yellow highlighting shows the five genes in the A. clavatus ACE1 cluster whose closest relatives are genes from part B of the M. grisea cluster. Bootstrap percentages are shown for all nodes. Trees were constructed from amino acid sequences as described in Methods using PHYML after alignment with ClustalW and Gblocks filtering. Trees for the other five genes in the ACE1 cluster are shown in Additional data file 1. The values of the shape parameter (α) for the gamma distribution were estimated from the data as 1.329, 1.441, 2.476, 2.615, 2.536 and 0.961 for panels a-f, respectively. The proportions of invariant sites are 0.028, 0.035, 0.030, 0.068, 0.000 and 0.000, respectively. The M. grisea SYN2 gene corresponds to parts of the automatically-annotated gene models MGG_12452.5 and MGG_12451.5.
Figure 3
Figure 3
Inferred history of ACE1 and ACE1-like clusters in filamentous fungi. The gray rectangle corresponds to the ancient core cluster of three genes (ACE1, RAP1, ORF3) that is common to all ACE1 clusters (pink) and ACE1-like clusters (orange). The black arrow denotes the inferred HGT of part B of the cluster from a donor related to M. grisea to the A. clavatus recipient. Dashed branches and smaller fonts indicate euascomycetes that were included in our analysis but lack the clusters entirely. Phylogenetic relationships are based on [27] and N Fedorova and N Khaldi, unpublished data, for the topology within the genus Aspergillus. The tree is not drawn to scale.

Similar articles

Cited by

References

    1. Keller NP, Hohn TM. Metabolic pathway gene clusters in filamentous fungi. Fungal Genet Biol. 1997;21:17–29. doi: 10.1006/fgbi.1997.0970. - DOI - PubMed
    1. Hurst LD, Pal C, Lercher MJ. The evolutionary dynamics of eukaryotic gene order. Nat Rev Genet. 2004;5:299–310. doi: 10.1038/nrg1319. - DOI - PubMed
    1. Qi X, Bakht S, Leggett M, Maxwell C, Melton R, Osbourn A. A gene cluster for secondary metabolism in oat: implications for the evolution of metabolic diversity in plants. Proc Natl Acad Sci USA. 2004;101:8233–8238. doi: 10.1073/pnas.0401301101. - DOI - PMC - PubMed
    1. Shimura K, Okada A, Okada K, Jikumaru Y, Ko KW, Toyomasu T, Sassa T, Hasegawa M, Kodama O, Shibuya N, Koga J, Nojiri H, Yamane H. Identification of a biosynthetic gene cluster in rice for momilactones. J Biol Chem. 2007;282:34013–34018. doi: 10.1074/jbc.M703344200. - DOI - PubMed
    1. Singer GAC, Lloyd AT, Huminiecki LB, Wolfe KH. Clusters of co-expressed genes in mammalian genomes are conserved by natural selection. Mol Biol Evol. 2005;22:767–775. doi: 10.1093/molbev/msi062. - DOI - PubMed

Publication types

Substances