. 2008 Mar 28;283(13):8136-44.
doi: 10.1074/jbc.M708761200. Epub 2008 Jan 24.

Characterization of the gating brake in the I-II loop of Ca(v)3.2 T-type Ca(2+) channels

Affiliations

Characterization of the gating brake in the I-II loop of Ca(v)3.2 T-type Ca(2+) channels

Imilla I Arias-Olguín et al. J Biol Chem. .

Abstract

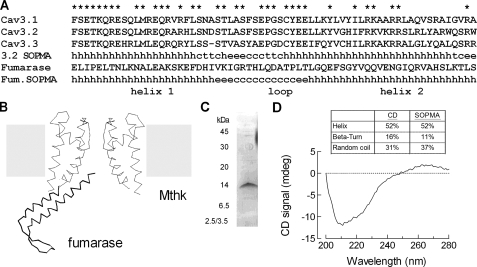
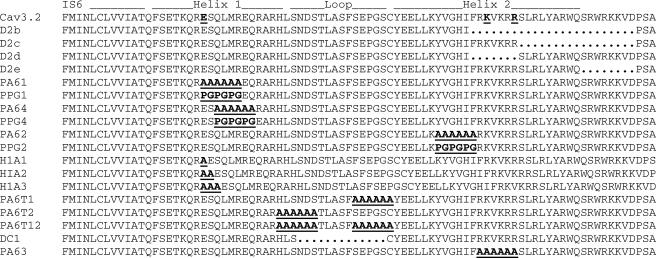
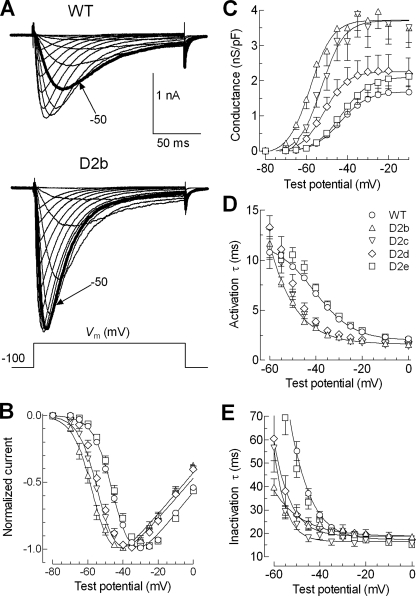
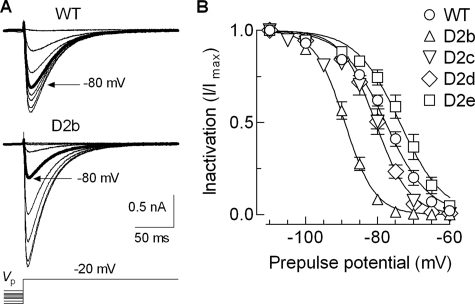
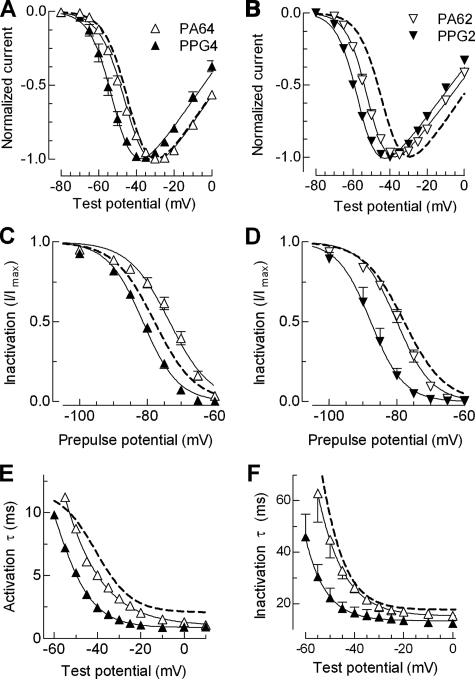
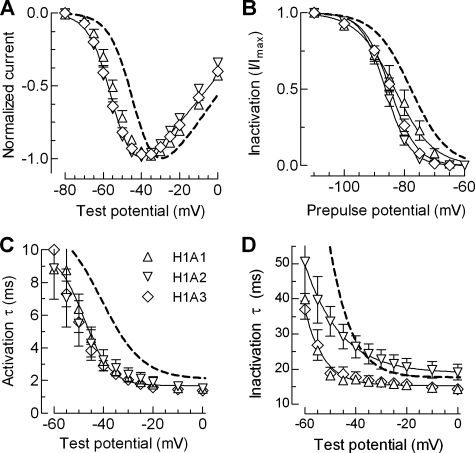
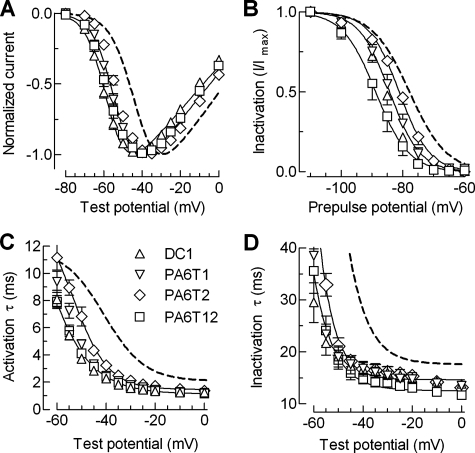
Mutations in the I-II loop of Ca(v)3.2 channels were discovered in patients with childhood absence epilepsy. All of these mutations increased the surface expression of the channel, whereas some mutations, and in particular C456S, altered the biophysical properties of channels. Deletions around C456S were found to produce channels that opened at even more negative potentials than control, suggesting the presence of a gating brake that normally prevents channel opening. The goal of the present study was to identify the minimal sequence of this brake and to provide insights into its structure. A peptide fragment of the I-II loop was purified from bacteria, and its structure was analyzed by circular dichroism. These results indicated that the peptide had a high alpha-helical content, as predicted from secondary structure algorithms. Based on homology modeling, we hypothesized that the proximal region of the I-II loop may form a helix-loop-helix structure. This model was tested by mutagenesis followed by electrophysiological measurement of channel gating. Mutations that disrupted the helices, or the loop region, had profound effects on channel gating, shifting both steady state activation and inactivation curves, as well as accelerating channel kinetics. Mutations designed to preserve the helical structure had more modest effects. Taken together, these studies showed that any mutations in the brake, including C456S, disrupted the structural integrity of the brake and its function to maintain these low voltage-activated channels closed at resting membrane potentials.


Figures

FIGURE 1.
FIGURE 1.
Secondary structure of the brake region within the proximal I-II loop of Cav3.2 calcium channels. A, alignment of the three human Cav3 channels. Asterisks highlight the amino acids that are conserved among all three T-channels. The predicted secondary structure of Cav3.2 is shown, where h stands for α-helix, c stands for coil, e stands for β-sheet, and t stands for turn. Also shown is the amino acid sequence of the region of fumarase that forms a helix-loop-helix structure, as well its predicted secondary structure. B, schematic of the initial region of I-II loop made using the crystal structure of fumarase and the potassium channel (MthK). The fumarase structure contains five helices packed around a hydrophobic core, and only two of the helices are shown in the schematic. C, gel of the purified I-II loop peptide (amino acids 424–528 of Cav3.2, GenBank™ accession number AF051946). The protein was purified as a fusion protein with MBP and then cleaved. D, CD spectra of the I-II loop peptide. The CD and SOPMA estimations of the dominant organized structures of this intracellular loop are shown in percentages of α-helix, β-turn, and random coil above the CD spectra.
FIGURE 2.
FIGURE 2.
Location of mutations made in the proximal region of the I-II loop of a human Cav3.2 channel. Amino acid sequences of each of the mutants beginning at residue 409 in the middle of the IS6 segment. The bold underlined letters in the mutants highlight the amino acids changed, whereas the periods represent the amino acids deleted. The residues involved in forming a putative salt bridge are also underlined and in bold type in the WT sequence.
FIGURE 3.
FIGURE 3.
Mapping the distal terminus of the brake region. A, representative families of whole cell Ca2+ currents recorded from HEK-293 cells expressing WT (upper records) and D2b mutant (bottom records) Cav3.2 channels. The currents were activated by depolarizing steps from –80 to +20 mV from a holding potential of –100 mV. The traces obtained during steps to –50 mV are shown in bold type to emphasize the shift in the position of the I-V curve. The scale bar applies to both families of traces. B, normalized I-V curves for WT and deletion mutants. Smooth curves represent modified Boltzmann (see “Experimental Procedures”) fits to the average data. The data in Table 1 show the averages obtained from fits to the raw current data from each individual cell. C, plots of conductance normalized to current densities versus test potential. D and E, voltage dependence of the time constants of activation (D) and inactivation (E) kinetics. Time constants (obtained from two exponential fits of the raw traces) were plotted as a function of membrane potential. The symbols used to represent WT and mutants are given in D.
FIGURE 4.
FIGURE 4.
Effects of helix 2 deletions on steady state inactivation. A, examples of Ca2+ currents recorded at –20 mV after 15-s prepulses to increasing values of voltages between –110 and –40 mV in HEK-293 cells expressing WT (upper records) and D2b mutant (bottom records) Cav3.2 channels. B, steady state inactivation curves. Maximal current (Imax) during the test pulse was obtained when the prepulse potential was –110 mV. Channel availability was calculated by dividing the remaining current (I) at –20 mV by Imax and expressed as a function of the prepulse potential. The smooth curves represent Boltzmann fits to the average data. The results from the averages of individual fits to each cell are reported in Table 1.
FIGURE 5.
FIGURE 5.
Biophysical properties of mutants to probe the helical structure of putative helices 1 and 2. A and B, normalized I-V curves for PA and PPG mutations made in helix 1 (A) and helix 2 (B). Labeling of symbols in these panels applies to the entire figure. C and D, effect of these mutations on steady state inactivation. The data points were obtained by plotting the normalized peak Ca2+ current at –20 mV against the prepulse potential for the indicated mutants. The smooth curves represent Boltzmann fits to the average data. The results from the average of individual fits to each cell are reported in Table 1. E and F, voltage dependence of the time constants of activation (E) and inactivation kinetics (F) of the helix 1 mutants PA64 and PPG4. Time constants were obtained from two exponential fits of the raw traces and plotted against membrane potential. WT channel properties are represented with a dotted line.
FIGURE 6.
FIGURE 6.
Biophysical properties of alanine insertion mutants designed to probe the orientation of the brake region. A, normalized I-V curves for H1A1, H2A2, and H1A3 channels. B, effects of alanine insertions on steady state inactivation. The data points were obtained by plotting the normalized peak Ca2+ current at –20 mV against the prepulse potential for the indicated mutants. The smooth curves represent Boltzmann fits to the average data. The results from the average of individual fits to each cell are reported in Table 1. C and D, voltage dependence of the time constants of activation and inactivation. Time constants were obtained from two exponential fits of the raw traces and plotted against membrane potential. The smooth curves represent Boltzmann fits to the data. WT channel properties are represented with a dotted line.
FIGURE 7.
FIGURE 7.
Biophysical properties of the mutations made to disrupt the putative loop of the brake region. A, normalized IV plots for the DC1, PA6T1, PA6T2, and PA6T12 mutants. B, effects of these mutations on steady state inactivation. The data points were obtained by plotting the normalized peak Ca2+ current at –20 mV against the prepulse potential for the indicated mutants. The smooth curves represent Boltzmann fits to the average data. The results from the average of individual fits to each cell are reported in Table 1. C and D, voltage dependence of the time constants of activation (C) and inactivation (D) kinetics. Time constants were obtained from two exponential fits of the raw traces and plotted against membrane potential.

Similar articles

Cited by

References

    1. Catterall, W. A., Perez-Reyes, E., Snutch, T. P., and Striessnig, J. (2005) Pharmacol. Rev. 57 411–425 - PubMed
    1. Bean, B. P. (1989) Annu. Rev. Physiol. 51 367–384 - PubMed
    1. Matteson, D. R., and Armstrong, C. M. (1986) J. Gen. Physiol. 87 161–182 - PMC - PubMed
    1. Carbone, E., and Lux, H. D. (1984) Nature 310 501–502 - PubMed
    1. Jan, L. Y., and Jan, Y. N. (1990) Nature 345 672. - PubMed

Publication types

Substances

LinkOut - more resources