. 2008 Jan 25;319(5862):482-4.
doi: 10.1126/science.1151582.

The frequency dependence of osmo-adaptation in Saccharomyces cerevisiae

Affiliations

The frequency dependence of osmo-adaptation in Saccharomyces cerevisiae

Jerome T Mettetal et al. Science. .

Abstract

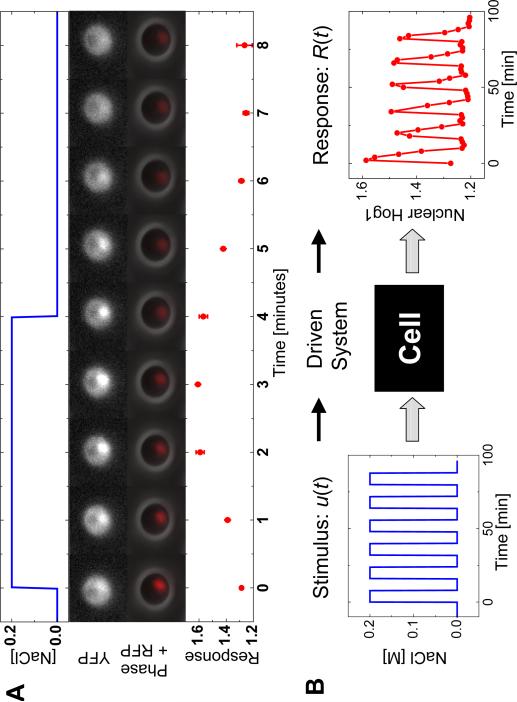
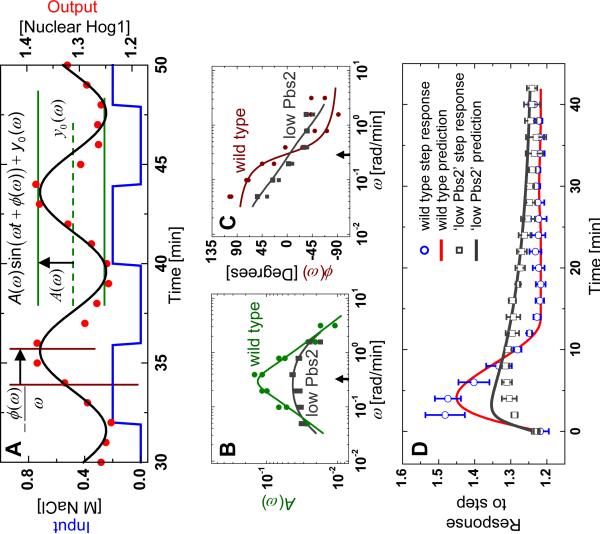
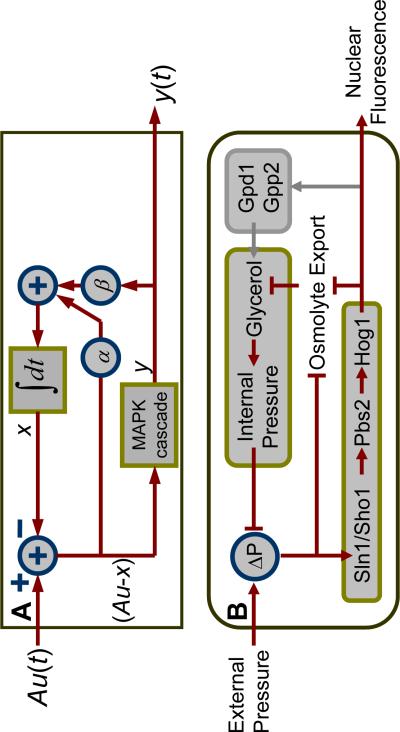
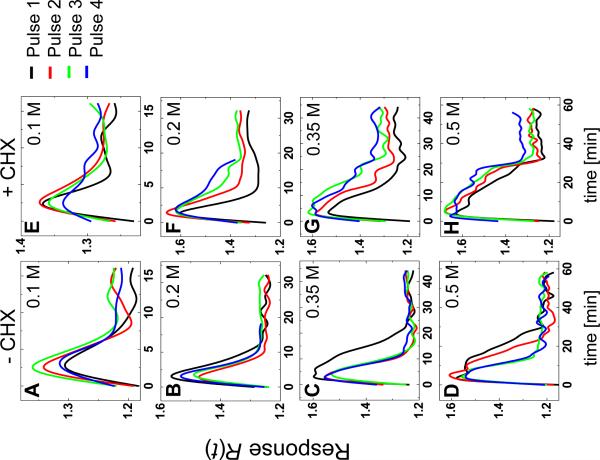
The propagation of information through signaling cascades spans a wide range of time scales, including the rapid ligand-receptor interaction and the much slower response of downstream gene expression. To determine which dynamic range dominates a response, we used periodic stimuli to measure the frequency dependence of signal transduction in the osmo-adaptation pathway of Saccharomyces cerevisiae. We applied system identification methods to infer a concise predictive model. We found that the dynamics of the osmo-adaptation response are dominated by a fast-acting negative feedback through the kinase Hog1 that does not require protein synthesis. After large osmotic shocks, an additional, much slower, negative feedback through gene expression allows cells to respond faster to future stimuli.


Figures

Fig. 1
Fig. 1
Enrichment of Hog1 nuclear localization is driven by pulsed salt shocks. (A) Localization of the fusion protein Hog1-YFP and the nuclear marker Nrd1-RFP by fluorescence microscopy. NaCl (0.2 M) was applied and removed Hog1-YFP as shown by the blue line. The population average translocation response (red circles) was defined by the ratio of average YFP fluorescence in the nucleus to the average YFP fluorescence. (B) Oscillations of Hog1-YFP translocation in a population of cells (red circles) in response to square wave oscillations in the input of extracellular NaCl (blue line).
Fig. 2
Fig. 2
Fourier analysis, model fits, and model predictions of Hog1 nuclear enrichment. (A) Illustration of the input (NaCl concentration, blue line), the network response (Hog1-YFP translocation, red circles), and the sine wave (black line) corresponding to the Fourier transform of the response at the driving frequency ω. This Fourier component is described by three parameters: A(ω) (green) representing the amplitude of the oscillations, ϕ(ω) (brown) representing the phase delay between the input and the response oscillations, and y0(ω) representing the signal offset. (B) Measurement of the Fourier amplitude A(ω) (green dots) over a range of driving frequencies along with model fit (green line). (C) Phase of the response measured relative to the driving signal (brown dots) along with model prediction of the phase (brown line). (D) Response of the system to a step increase of 0.2 M NaCl compared to the step response predicted by the model. The `Low Pbs2' data (gray boxes) is gathered from the Pbs2 under-expression mutant strain and was used to generate the model fit (gray line in (B)) and model predictions (gray lines in (C) and (D)).
Fig. 3
Fig. 3
Network topology implied by pulsed-input analysis corresponds to biological network. (A) Diagramatic representation of the mechanistic model shows two linear negative feedbacks: one dependent on Hog1 activity with strength β, and a second independent of Hog1 activity with strength α. The intracellular osmotic pressure was modeled as an integrator, whereas the MAPK signal transduction pathway was modeled by the linear impulse response function. The output of circumscribed-plus-sign symbols is simply the sum of its inputs. (B) The osmo-adaptation network structure. Upon osmotic stress, cells increase or decrease their export rate of glycerol through the trans-membrane protein Fps1, which is modified by Hog1-independent and Hog1-dependent mechanisms. In addition, under high osmotic stresses, active nuclear Hog1 is known to modify the expression of glycerol producing proteins over longer timescales. ΔP represents the difference between internal and external pressure relative to its optimal value.
Fig. 4
Fig. 4
Gene expression facilitates response to subsequent pulses. Consecutive-pulse responses were compared for cells treated with (A) 0.1 M NaCl, 16 min. period (i.e., 8 min at 0.1 M followed by 8 min at 0.0 M), (B) 0.2 M NaCl, 32 min. period, (C) 0.35 M NaCl, 45 min. period, and (D) 0.5 M NaCl, 60 min. period. (E–H) Similarly treated cells also exposed to cycloheximide.

Comment in

Similar articles

Cited by

References

    1. Tyson JJ, Chen K, Novak B. Nat Rev Mol Cell Biol. 2001;2:908–16. - PubMed
    1. Slepchenko BM, Schaff JC, Macara I, Loew LM. Trends Cell Biol. 2003;13:570–6. - PubMed
    1. Kitano H, Funahashi A, Matsuoka Y, Oda K. Nat Biotechnol. 2005;23:961–6. - PubMed
    1. Klipp E, Nordlander B, Kruger R, Gennemark P, Hohmann S. Nat Biotechnol. 2005;23:975–82. - PubMed
    1. Oppenheim AV, Willsky AS, Young IT. Signals and systems. Prentice-Hall; 1983.

Publication types

MeSH terms

Substances