. 2008 Mar;146(3):1064-74.
doi: 10.1104/pp.107.112946. Epub 2008 Jan 24.

The structure of chloroplast DNA molecules and the effects of light on the amount of chloroplast DNA during development in Medicago truncatula

Affiliations

The structure of chloroplast DNA molecules and the effects of light on the amount of chloroplast DNA during development in Medicago truncatula

Jeffrey M Shaver et al. Plant Physiol. 2008 Mar.

Abstract

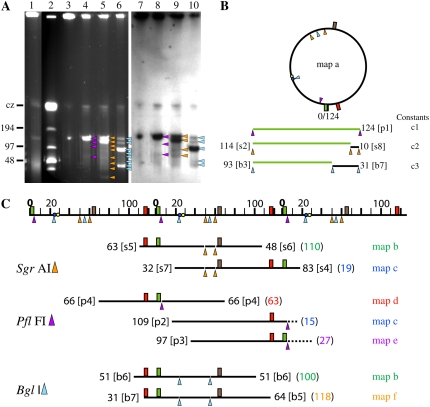
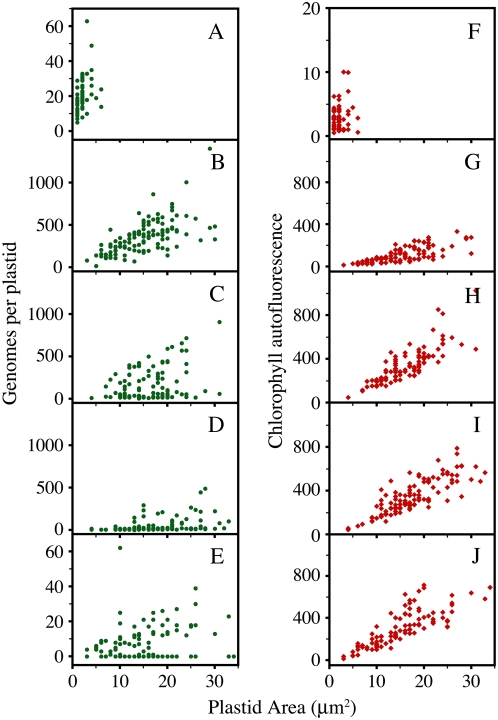
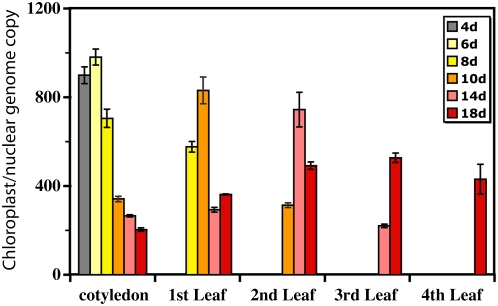
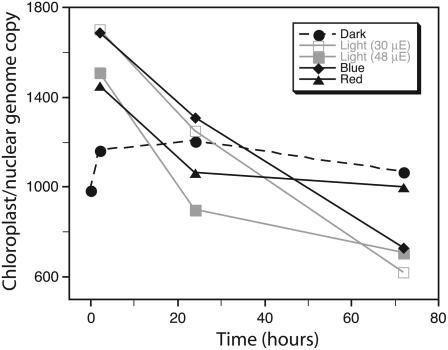
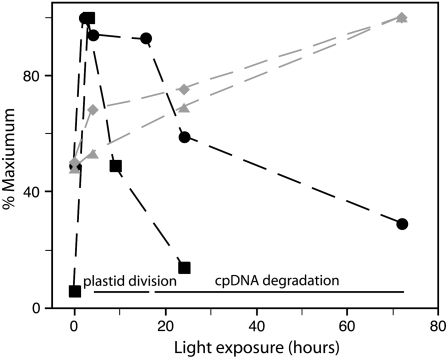
We used pulsed-field gel electrophoresis and restriction fragment mapping to analyze the structure of Medicago truncatula chloroplast DNA (cpDNA). We find most cpDNA in genome-sized linear molecules, head-to-tail genomic concatemers, and complex branched forms with ends at defined sites rather than at random sites as expected from broken circles. Our data suggest that cpDNA replication is initiated predominantly on linear DNA molecules with one of five possible ends serving as putative origins of replication. We also used 4',6-diamidino-2-phenylindole staining of isolated plastids to determine the DNA content per plastid for seedlings grown in the dark for 3 d and then transferred to light before being returned to the dark. The cpDNA content in cotyledons increased after 3 h of light, decreased with 9 h of light, and decreased sharply with 24 h of light. In addition, we used real-time quantitative polymerase chain reaction to determine cpDNA levels of cotyledons in dark- and light-grown (low white, high white, blue, and red light) seedlings, as well as in cotyledons and leaves from plants grown in a greenhouse. In white, blue, and red light, cpDNA increased initially and then declined, but cpDNA declined further in white and blue light while remaining constant in red light. The initial decline in cpDNA occurred more rapidly with increased white light intensity, but the final DNA level was similar to that in less intense light. The patterns of increase and then decrease in cpDNA level during development were similar for cotyledons and leaves. We conclude that the absence in M. truncatula of the prominent inverted repeat cpDNA sequence found in most plant species does not lead to unusual properties with respect to the structure of plastid DNA molecules, cpDNA replication, or the loss of cpDNA during light-stimulated chloroplast development.


Figures

Figure 1.
Figure 1.
Maps of the M. truncatula chloroplast genome based on PflFI, SgrAI, and BglI digestions. A, PFGE and blot hybridization of undigested and enzyme-digested cpDNA. Lane 1, No pre-electrophoresis (see “Materials and Methods”); lane 2, size standards; lanes 3 to 10, after pre-electrophoresis. Lanes 1, 3, and 7, Undigested cpDNA; lanes 4 and 8, PflFI-digested cpDNA; lanes 5 and 9, SgrAI-digested cpDNA; lanes 6 and 10, BglI-digested cpDNA. Lanes 1 to 6, Ethidium fluorescence; lanes 7 to 10, ndhF hybridization. Fragment sizes for ethidium-stained PflFI- (p, purple triangles), SgrAI- (s, orange triangles), and BglI-digested (b, blue triangles) cpDNA in kilobase pairs and presence (+) or absence (−) of ndhF hybridization (Table I): p1, 124(+); p2, 109(−); p3, 97(+); p4, 66(+); s1, 124(+); s2, 114(+); s3, 101(−); s4, 83(+); s5, 63(+); s6, 48(−); s7, 32(−); s8, 10(−); b1, 124(+); b2, 112(+); b3, 93(+); b4, 77(−); b5, 64(−); b6, 51(+); b7, 31(+); and b8, 29(−). Lower exposures (not shown) show fragments s1 and s2 as discrete bands in lanes 5 and 9. Fragments s1, b1, and b2 probably result from incomplete digestion. cz, Compression zone. B, Map a, the circular map of the M. truncatula chloroplast genome. Symbols: purple triangle, PflFI; blue triangles, BglI; orange triangles, SgrAI; red rectangle, rbcL; green rectangle, ndhF; brown rectangle, petA; blue circle, homolog of Oenothera oriB; yellow circle, homolog of Oenothera oriA. Constants c1 to c3 are predicted fragments resulting from digestion of a circular or h-t multigenomic linear molecule with a one-cut (PflFI) or two-cut (SgrAI or BglI) restriction enzyme. C, Maps b to f, linear maps. A linear scale is shown at the top with units in kilobase pairs. The circular (B) and linear (C) maps are proportional but not drawn to the same scale. Linear maps of 124-kb monomers were constructed as follows: map c is constructed with an internal SgrAI constant fragment of 10 kb (s8) and two SgrAI end fragments (s4 and s7) of 83 and 32 kb, respectively, nearly equaling 124 kb and giving an end near 20 kb (near homologs of Oenothera oriA and oriB). Map f is constructed with an internal BglI constant fragment of 31 kb (b7) and two BglI end fragments (b5 and b7; 64 and 31 kb, respectively), nearly equaling 124 kb and giving an end near 120 kb (near rbcL, trnK-UUU, matK, and psbA genes). The dashed lines in PflFI maps c and e represent predicted fragments (15 and 27 kb, respectively) that were not visible by ethidium staining. Only maps supported by more than one enzyme digestion or probe are shown.
Figure 2.
Figure 2.
The effect of white light on genome copy number and chlorophyll autofluorescence per plastid and plastid area. Plastids were isolated from cotyledons of 5-d-old seedlings grown under: constant dark; constant dark for 3 d, given a period of white light for 3, 9, or 24 h, and then returned to the dark; or 16-h-light/8-h-dark cycles. A to E, Genomes per plastid. F to J, Chlorophyll autofluorescence. Note that the scales in A, E, and F are changed. A and F, Constant dark; B and G, 3-h light period; C and H, 9-h light period; D and I, 24-h light period; E and J, 16-h-light/8-h-dark cycles. Each point represents one plastid. For statistical information, see Table II. [See online article for color version of this figure.]
Figure 3.
Figure 3.
The effect of tissue age on the abundance of cpDNA. Total tissue DNA was extracted from cotyledons and the first, second, third, and fourth leaves (if available) of 4-, 6-, 8-, 10-, 14-, and 18-d-old plants. The ratio of chloroplast to nuclear genome copies was determined by real-time qPCR with petA (chloroplast) and enod11 (nuclear) probes, respectively. Note that the absence of bars does not indicate readings of zero DNA but that these tissues were not present at those stages of plant development. For statistical information, see Table IV.
Figure 4.
Figure 4.
The effect of light quality, intensity, and duration on the abundance of cpDNA. Total cotyledon DNA was extracted from seedlings grown under: 3 d of constant dark with an additional 2, 24, or 72 h of dark; or 3 d constant dark followed by a period of light (low white, high white, blue, or red) for 2, 24, or 72 h. The ratio of chloroplast to nuclear genome copies was determined by real-time qPCR with petA (chloroplast) and enod11 (nuclear) probes, respectively. For statistical information, see Table V.
Figure 5.
Figure 5.
Changes in cpDNA abundance during cotyledon development. Plastids were isolated from cotyledons of 5-d-old seedlings grown under constant dark, or constant dark for 3 d followed by a period of white light for 3, 9, or 24 h and then returned to the dark (Fig. 2; Table II). In a separate experiment, total cotyledon DNA was extracted from seedlings grown under 3 d of constant dark or 3 d constant dark followed by a period of white light for 2, 4, 16, 24, or 72 h (Fig. 4; Tables III and V). The ratio of chloroplast to nuclear genome copies was determined by real-time qPCR with petA (chloroplast) and enod11 (nuclear) probes, respectively. The lengths and widths of cotyledons were measured. Five cotyledon measurements were made after 0, 4, and 24 h of illumination, and three measurements were made after 72 h of illumination. The mean cotyledon lengths ± se after 0, 4, and 24 h were 4.2 ± 0.2, 4.6 ± 0.2, and 6 ± 0.3 mm, respectively. The mean cotyledon widths ± se after 0, 4, and 24 h were 1.4 ± 0.2, 1.9 ± 0.1, and 2.1 ± 0.1 mm, respectively. The cotyledon lengths after 72 h were 8, 8, and 10 mm, and the widths were 2.5, 3, and 3 mm. Black squares, Genomes per plastid; black circles, plastid genomes per nuclear genome copy; gray diamonds, mean cotyledon width; grey triangles, mean cotyledon length.

Similar articles

Cited by

References

    1. Baumgartner BJ, Rapp JC, Mullet JE (1989) Plastid transcription activity and DNA copy number increase early in barley chloroplast development. Plant Physiol 89 1011–1018 - PMC - PubMed
    1. Bendich A (1991) Moving pictures of DNA released upon lysis from bacteria, chloroplasts, and mitochondria. Protoplasma 160 121–130
    1. Bendich A, Smith S (1990) Moving pictures and pulsed-field gel electrophoresis show linear DNA molecules from chloroplasts and mitochondria. Curr Genet 17 421–425 - PubMed
    1. Chiu WL, Sears BB (1992) Electron microscopic localization of replication origins in Oenothera chloroplast DNA. Mol Gen Genet 232 33–39 - PubMed
    1. Dubell AN, Mullet JE (1995. a) Continuous far-red light activates plastid DNA synthesis in pea leaves but not full cell enlargement or an increase in plastid number per cell. Plant Physiol 109 95–103

Publication types

Substances

Associated data

LinkOut - more resources