. 2008 Mar 28;102(6):737-45.
doi: 10.1161/CIRCRESAHA.107.168112. Epub 2008 Jan 24.

Tunnel propagation of postshock activations as a hypothesis for fibrillation induction and isoelectric window

Affiliations

Tunnel propagation of postshock activations as a hypothesis for fibrillation induction and isoelectric window

Takashi Ashihara et al. Circ Res. .

Abstract

Comprehensive understanding of the ventricular response to shocks is the approach most likely to succeed in reducing defibrillation threshold. We propose a new theory of shock-induced arrhythmogenesis that unifies all known aspects of the response of the heart to monophasic (MS) and biphasic (BS) shocks. The central hypothesis is that submerged "tunnel" propagation of postshock activations through shock-induced intramural excitable areas underlies fibrillation induction and the existence of isoelectric window. We conducted simulations of fibrillation induction using a realistic bidomain model of rabbit ventricles. Following pacing, MS and BS of various strengths/timings were delivered. The results demonstrated that, during the isoelectric window, an activation originated deep within the ventricular wall, arising from virtual electrodes; it then propagated fully intramurally through an excitable tunnel induced by the shock, until it emerged onto the epicardium, becoming the earliest-propagated postshock activation. Differences in shock outcomes for MS and BS were found to stem from the narrower BS intramural postshock excitable area, often resulting in conduction block, and the difference in the mechanisms of origin of the postshock activations, namely intramural virtual electrode-induced phase singularity for MS and virtual electrode-induced propagated graded response for BS. This study provides a novel analysis of the 3D mechanisms underlying the origin of postshock activations in the process of fibrillation induction by MS and BS and the existence of isoelectric window. The tunnel propagation hypothesis could open a new avenue for interventions exploration to achieve significantly lower defibrillation threshold.


Figures

Figure 1
Figure 1
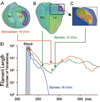
Rabbit ventricular model and shock electrode configuration. Anterior (A) and posterior (B) views. Short white lines represent fiber orientation. C, Ventricles within perfusing chamber with pacing and shock electrodes. RV indicates right ventricle.
Figure 2
Figure 2
A, Vulnerability grids for MSs, encompassing episodes of no response and sustained and nonsustained arrhythmias. Episodes in pink denote arrhythmia induction following IW. Images at bottom present preshock states for the coupling intervals in the grid. B through D, Shock-induced responses: arrhythmia noninduction (B) and induction of sustained arrhythmia with (C) and without (D) IW. In transparent views, wavefronts are shown in gray and asterisks mark intramural postshock activations. White arrows denote direction of propagation. Vertical dotted line indicates shock end. Supplemental Movies I through III are movie supplements to B through D, respectively.
Figure 3
Figure 3
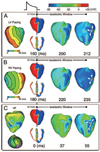
A, Vulnerability grids for BSs, encompassing episodes of no response and sustained and nonsustained arrhythmias. Episodes in blue denote arrhythmia induction following IW. Preshock states are shown at bottom. B through D, Shock-induced responses: arrhythmia noninduction (B) and induction of sustained arrhythmia with (C) and without (D) IW. Zigzag arrows denote propagated graded responses. Other symbols and abbreviations as in Figure 2. Supplemental Movie IV through Supplemental Movie VI are movie supplements to B through D, respectively.
Figure 4
Figure 4
Relationships between shock strength and IW for MS (A) and BS (B). Open circles correspond to episodes within pink areas in Figure 2A and blue areas in Figure 3A. Solid lines represent least mean square approximation.
Figure 5
Figure 5
A, Distributions of transmembrane potential in a ventricular cross-section during the shock (226 ms), at shock end (230 ms), and 10 ms after (240 ms) for 16 V/cm MS and BS, both at a 220-ms coupling interval. Filled triangles indicate depolarization on LV epicardium. B, Propagation, in the region shown in inset, of initiating PA following MS. Black open triangles indicate immediate postshock excitation. Asterisk denotes initiating PA arising from intramural VEs. C, Initiating PA following 12 V/cm BS. Left, preshock state in a ventricular cross-section. Right, Insets showing transmembrane potential distributions at the end of first (226 ms) and second (230 ms) pulses and at several instances postshock. White open triangles indicate postshock refractory tissue. Zigzag arrow represents propagated graded response. In B and C, white arrows mark propagation direction. D, Action potentials recorded at sites 1 to 3 in C. Gray denotes shock duration. Green and red arrows represent graded response at site 2 and electro-tonic depolarization at site 1, respectively.
Figure 6
Figure 6
Scroll wave O-filament arising from MS (A) and BS (B) just below the respective ULVs (16 and 12 V/cm). C, Inset with focal pattern of breakthrough following 12 V/cm BS; O-filament is within the wall. D, Filament lengths during and after 16 V/cm MS (red line), and 12 and 16 V/cm BSs (green and blue lines, respectively). Gray denotes shock duration. Red, green, and blue dots mark filament length at shock end. Red and green asterisks denote time of appearance of the earliest propagated PA.
Figure 7
Figure 7
MS episodes for different pacing sites (A and B) and an episode of MS given to fibrillating ventricles (C). Preshock state (left images) is presented as activation maps (A and B) and in terms of transmembrane potential distribution (C, top) and scroll wave filaments (C, bottom). In C, time is counted from the end of MS.

References

    1. Runsio M, Kallner A, Kallner G, Rosenqvist M, Bergfeldt L. Myocardial injury after electrical therapy for cardiac arrhythmias assessed by troponin-T release. Am J Cardiol. 1997;79:1241–1245. - PubMed
    1. Maisel WH. Pacemaker and ICD generator reliability: meta-analysis of device registries. JAMA. 2006;295:1929–1934. - PubMed
    1. Chen PS, Shibata N, Dixon EG, Wolf PD, Danieley ND, Sweeney MB, Smith WM, Ideker RE. Activation during ventricular defibrillation in open-chest dogs: evidence of complete cessation and regeneration of ventricular fibrillation after unsuccessful shocks. J Clin Invest. 1986;77:810–823. - PMC - PubMed
    1. Shibata N, Chen PS, Dixon EG, Wolf PD, Danieley ND, Smith WM, Ideker RE. Epicardial activation after unsuccessful defibrillation shocks in dogs. Am J Physiol. 1988;255:H902–H909. - PubMed
    1. Wang NC, Lee MH, Ohara T, Okuyama Y, Fishbein GA, Lin SF, Karagueuzian HS, Chen PS. Optical mapping of ventricular defibrillation in isolated swine right ventricles: demonstration of a postshock isoelectric window after near-threshold defibrillation shocks. Circulation. 2001;104:227–233. - PubMed

Publication types