. 2008 Jun;38(6):671-8.
doi: 10.1165/rcmb.2007-0205OC. Epub 2008 Jan 24.

CaSm (LSm-1) overexpression in lung cancer and mesothelioma is required for transformed phenotypes

Affiliations

CaSm (LSm-1) overexpression in lung cancer and mesothelioma is required for transformed phenotypes

Patricia M Watson et al. Am J Respir Cell Mol Biol. 2008 Jun.

Abstract

CaSm (cancer-associated Sm-like) was originally identified based on elevated expression in pancreatic cancer and in several cancer-derived cell lines. It encodes a 133-amino acid protein that contains two Sm motifs found in the common snRNP proteins and the LSm (like-Sm) family of proteins. Lung tumors and mesotheliomas express high levels of CaSm mRNA and protein compared with adjacent nontumor and normal lung tissue, measured by immunohistochemistry, qRT-PCR, and Western blot analyses. In addition, several human lung cancer- and mesothelioma-derived cell lines have elevated CaSm expression. Two cell lines, transfected with and expressing antisense CaSm RNA, demonstrate altered transformed phenotypes, reducing their ability to form colonies in soft agar and tumors in SCID mice. Furthermore, RNAi-mediated reduction of CaSm RNA and protein is associated with inhibition of cellular growth. These data support the model that elevated CaSm expression in epithelial tissue contributes to the transformed state. Cell lines expressing exogenous CaSm also exhibit transformed characteristics, including increased anchorage-independent colony formation and tumor growth. Thus, the results of loss of function and gain of function studies presented both indicate that CaSm functions as an oncogene in the promotion of cellular transformation and cancer progression.


Figures

<b>Figure 1.</b>
Figure 1.
Immunohistochemical demonstration of CaSm protein overexpression in lung cancer and mesothelioma. Paraffin-fixed sections stained with rabbit anti-CaSm antibody using Vectastain anti-rabbit Impress reagent with DAB and hematoxylin counterstain showing high levels of cytoplasmic expression of CaSm in tumor tissue. (A) Adenocarcinoma: a, d, and e, mucinous adenocarcinoma; b and c, nonmucinous adenocarcinoma (bar in a is 100 μm). (B) a–c, squamous cell carcinoma. (C) Bronchial alveolar carcinoma. (D) Mesothelioma: a, biphasic mesothelioma, sarcomatoid portion; b, biphasic mesothelioma, epithelial portion; c, epithelial mesothelioma; d, epithelial mesothelioma (bar is 50 μm). (E) Normal lung (bar is 50 μm). Magnification is the same in A–D, a–c.
<b>Figure 2.</b>
Figure 2.
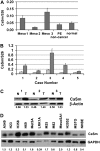
CaSm mRNA and protein are expressed at higher level in mesothelioma and lung tumor tissue compared with adjacent nontumor tissue and in lung cancer– and mesothelioma-derived cell lines. (A) Quantitative real-time PCR using RNA extracted from a mesothelioma tumor (meso 1) or two pleural effusions (meso 2 and 3) showing elevated CaSm expression in two of the three cancers compared to a pleural effusion (PE) from a subject without cancer (“normal” lung). (B) Quantitative real-time PCR of RNA from five matched tumor (dark grey bars) and adjacent nontumor tissue (light grey bars) from non–small cell lung cancer (NSCLC). The diagnosis of the samples are: 1, squamous; 2, adenocarcinoma; 3, squamous; 4, adenocarcinoma; and 5, large cell carcinoma. The nontumor tissue was taken during surgery from an adjacent normal-appearing area. (C) Western blot of CaSm protein expression in three of the five NSCLC cases above. Tumor tissue shows elevated CaSm expression compared with nontumor tissue. Numbers below bands are mean quantitative values from densitometry from three individual Western blots. β-Actin is shown as a loading control. (D) Western blot of mesothelioma and lung cancer cell lines. A549, H23, and H358 are NSCLC-derived cell lines; H69 is an SCLC-derived cell line; Met5A is an immortalized mesothelial cell line; LRK1A, M25, M82, MesoSA1, H2052, and MSTO are mesothelioma-derived cell lines; and NHBE is normal human bronchial epithelium. GAPDH is shown as loading control. To compare the expression of CaSm in the different cell lines, the protein bands were quantified using Kodak Molecular imaging system and standardized to the GAPDH expression. The value for the normal bronchial epithelial cells is the mean of three independent extracts. Numbers below bands are mean quantitative values from densitometry from three individual Western blots using different cell extracts.
<b>Figure 3.</b>
Figure 3.
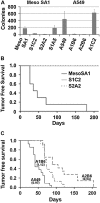
CaSm expression is correlated with cellular transformation. (A) Anchorage independent growth of antisense CaSm-transfected clones. Parental cells and antisense-expressing clones were grown in soft agar for 3 weeks. The number of colonies greater than 100 μm was determined. Values are mean of three independent experiments. Number of colonies for each transfected clone was compared with the parental cells using a two-sample t test. The P value for each antisense clone compared with parental cells was < 0.001. For the MesoSA1 cells and clones a Bonferroni adjustment was done, indicating a significant P value of < 0.017. (B and C) Tumor formation in vivo of antisense CaSm-transfected clones. Kaplan-Meier curves for (B) MesoSA1 and (C) A549 cells and MesoSA1 and A549 cells stably transfected with CaSm antisense. Cells were injected into SCID-Bg mice at Day 0, and tumor growth was monitored weekly. Five animals per group were used for the MesoSA1 cells and antisense clones, and 15 animals per group were used for the A549 cells and antisense clones. The data were plotted in Kaplan-Meier curves and analyzed using the log rank test and found to be significantly different (for MesoSA1 P value = 0.0018) (for A549 log-rank P value is < 0.0001). Densitometry values for CaSm protein expression in the extracted tumors are shown in C below labels. Values are the means from three Western blots on two tumors from A549 parental cells and three from each antisense clone. A2B6 protein expression is significantly lower than the parental A549 expression (P < 0.02). No tumors grew with the MesoSA1 clones.
<b>Figure 4.</b>
Figure 4.
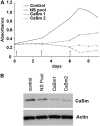
CaSm siRNA reduces cell growth. (A) MesoSA1 cells were transfected with two different CaSm siRNA oligomers and a pool of RNA oligomers (20nt) without homology to any known human mRNA sequence (NS pool) or maintained in medium (Control) and cell number was assessed using MTT for 8 days. Transfections were carried out on Days 0, 3, and 6 as indicated by the arrows. (B) MesoSA1 cells transfected with two different CaSm siRNA oligomers as above were harvested on Day 8 after transfection and analyzed by Western blot, which shows reduced CaSm protein levels compared with control and a nonspecific pool of RNA oligomers.
<b>Figure 5.</b>
Figure 5.
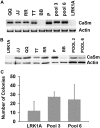
Increased CaSm expression leads to a more transformed phenotype in a non–CaSm-expressing mesothelioma cell line. (A) The mesothelioma cell line LRK1A was transfected with a full-length CaSm expression plasmid using Fugene and clones selected. Total RNA was isolated using Trizol, cDNA was prepared, and CaSm PCR performed as described in Materials and Methods. Actin PCR was performed as loading and cDNA quality control. (B) Western blot of LRK1A clones showing CaSm protein expression. (C) Nonadherent growth was assayed using soft agar colony formation assay. Cells were suspended in 0.3% agarose, and colonies greater than 100 μm were counted after 4 weeks of incubation. P < 0.025 for Pool 3 and P < 0.05 for Pool 6.

Similar articles

Cited by

References

    1. Jemal A, Siegel R, Ward E, Murray T, Xu J, Thun MJ. Cancer statistics, 2007. CA Cancer J Clin 2007;57:43–66. - PubMed
    1. Jett JR, Miller YE. Update in lung cancer 2005. Am J Respir Crit Care Med 2006;173:695–697. - PubMed
    1. Visbal AL, Williams BA, Nichols FC III, Marks RS, Jett JR, Aubry MC, Edell ES, Wampfler JA, Molina JR, Yang P. Gender differences in non-small-cell lung cancer survival: an analysis of 4,618 patients diagnosed between 1997 and 2002. Ann Thorac Surg 2004;78:209–215. (discussion 215). - PubMed
    1. Henschke CI, Yankelevitz DF, Libby DM, Pasmantier MW, Smith JP, Miettinen OS. Survival of patients with stage 1 lung cancer detected on ct screening. N Engl J Med 2006;355:1763–1771. - PubMed
    1. Bach PB, Jett JR, Pastorino U, Tockman MS, Swensen SJ, Begg CB. Computed tomography screening and lung cancer outcomes. JAMA 2007;297:953–961. - PubMed

Publication types

MeSH terms