

Inequalities in mortality during and after restructuring of the New Zealand economy: repeated cohort studies
- PMID: 18218998
- PMCID: PMC2244751
- DOI: 10.1136/bmj.39455.596181.25
Inequalities in mortality during and after restructuring of the New Zealand economy: repeated cohort studies
Abstract
Objectives: To determine whether disparities between income and mortality changed during a period of major structural and macroeconomic reform and to estimate the changing contribution of different diseases to these disparities.
Design: Repeated cohort studies.
Data sources: 1981, 1986, 1991, 1996, and 2001 censuses linked to mortality data. Population Total New Zealand population, ages 1-74 years.
Methods: Mortality rates standardised for age and ethnicity were calculated for each census cohort by level of household income. Standardised rate differences and rate ratios, and slope and relative indices of inequality (SII and RII), were calculated to measure disparities on both absolute and relative scales.
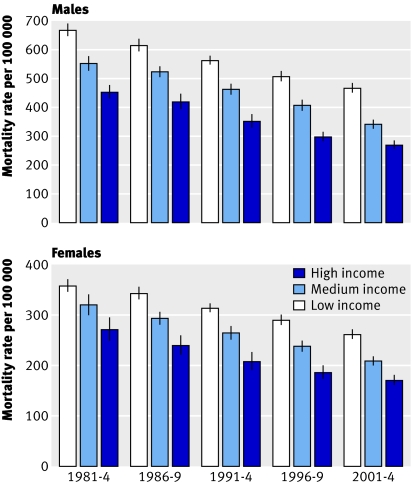
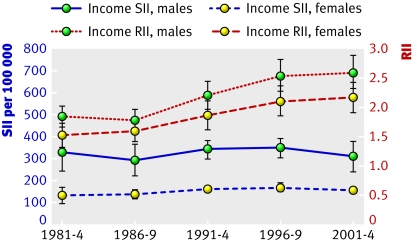
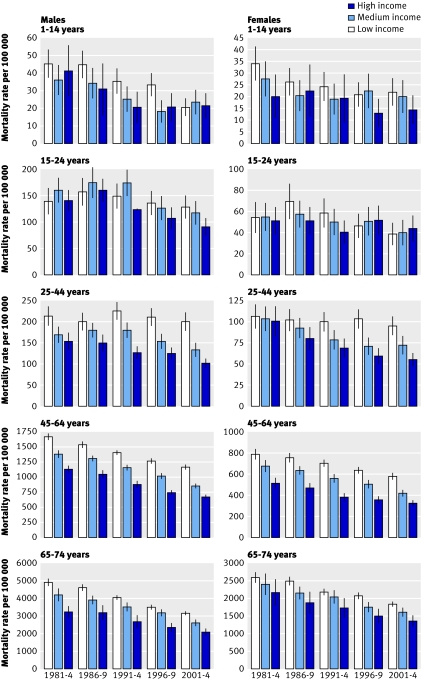
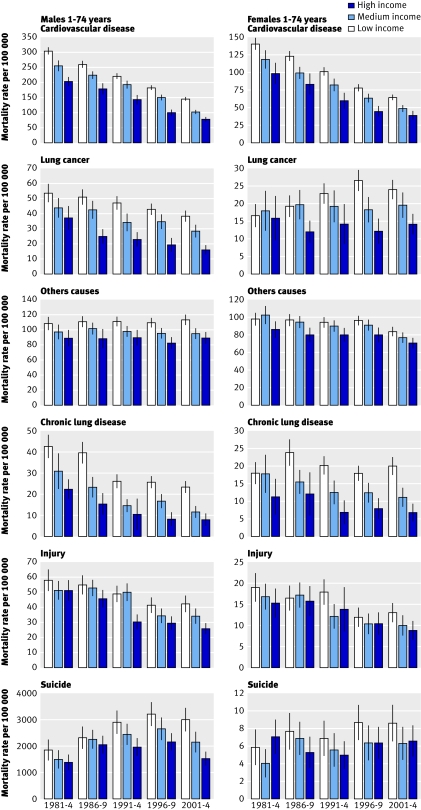
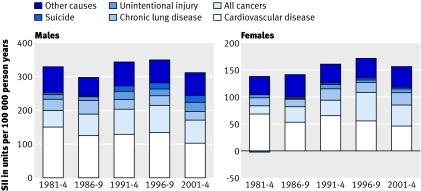
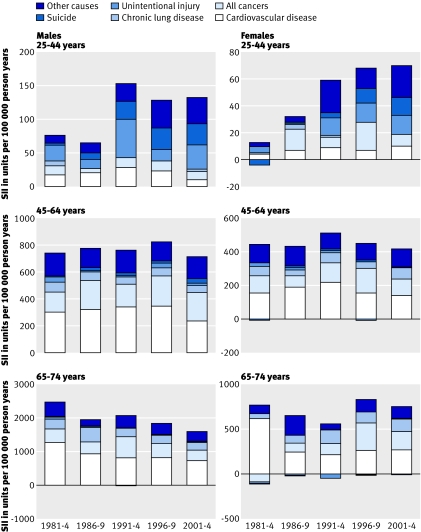
Results: All cause mortality rates declined over the 25 year study period in all groups stratified by sex, age, and income, except for 25-44 year olds of both sexes on low incomes among whom there was little change. In all age groups pooled, relative inequalities increased from 1981-4 to 1996-9 (RIIs increased from 1.85 (95% confidence interval 1.67 to 2.04) to 2.54 (2.29 to 2.82) for males and from 1.54 (1.35 to 1.76) to 2.12 (1.88 to 2.39) for females), then stabilised in 2001-4 (RIIs of 2.60 (2.34 to 2.89) and 2.18 (1.93 to 2.45), respectively). Absolute inequalities were stable over time, with a possible fall from 1996-9 to 2001-4. Cardiovascular disease was the major contributor to the observed disparities between income and mortality but decreased in importance from 45% in 1981-4 to 33% in 2001-4 for males and from 50% to 29% for females. The corresponding contribution of cancer increased from 16% to 22% for males and from 12% to 25% for females.
Conclusions: During and after restructuring of the economy disparities in mortality between income groups in New Zealand increased in relative terms (but not in absolute terms), but it is difficult to confidently draw a causal link with structural reforms. The contribution of different causes of death to this inequality changed over time, indicating a need to re-prioritise health policy accordingly.
Conflict of interest statement
Competing interests: None declared.
Figures
References
-
- Belich J. Paradise reforged: a history of the New Zealanders from the 1880s to the year 2000 Auckland: Penguin, 2001
-
- Cheyne C, O’Brien M, Belgrave M. Social policy in Aotearoa New Zealand: a critical introduction Auckland: Oxford University Press, 1997
-
- Boston J, Dalziel P, John S. Redesigning the welfare state in New Zealand: problems, policies and prospects Auckland: Oxford University Press, 1999
-
- Ministry of Social Policy. The social report: indicators of social well-being in New Zealand Wellington: Ministry of Social Policy, 2007
-
- Förster M, d’Ercole M. Income distribution and poverty in OECD countries in the second half of the 1990s. In: OECD social, employment and migration working papers Paris: OECD, 2005
Publication types
MeSH terms
LinkOut - more resources
Full Text Sources