. 2008 Feb;64(Pt 2):158-66.
doi: 10.1107/S090744490705812X. Epub 2008 Jan 16.

Protein crystallography with a micrometre-sized synchrotron-radiation beam

Affiliations

Protein crystallography with a micrometre-sized synchrotron-radiation beam

Rouslan Moukhametzianov et al. Acta Crystallogr D Biol Crystallogr. 2008 Feb.

Abstract

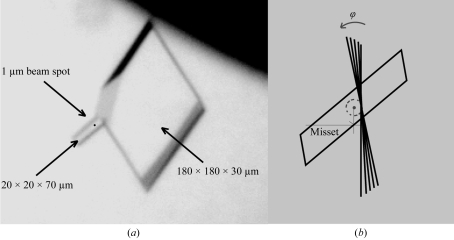
For the first time, protein microcrystallography has been performed with a focused synchrotron-radiation beam of 1 microm using a goniometer with a sub-micrometre sphere of confusion. The crystal structure of xylanase II has been determined with a flux density of about 3 x 10(10) photons s(-1) microm(-2) at the sample. Two sets of diffraction images collected from different sized crystals were shown to comprise data of good quality, which allowed a 1.5 A resolution xylanase II structure to be obtained. The main conclusion of this experiment is that a high-resolution diffraction pattern can be obtained from 20 microm(3) crystal volume, corresponding to about 2 x 10(8) unit cells. Despite the high irradiation dose in this case, it was possible to obtain an excellent high-resolution map and it could be concluded from the individual atomic B-factor patterns that there was no evidence of significant radiation damage. The photoelectron escape from a narrow diffraction channel is a possible reason for reduced radiation damage as indicated by Monte Carlo simulations. These results open many new opportunities in scanning protein microcrystallography and make random data collection from microcrystals a real possibility, therefore enabling structures to be solved from much smaller crystals than previously anticipated as long as the crystallites are well ordered.


Figures

Figure 1
Figure 1
Schematic design and distance indications of the undulator source and optics. A, low-β undulator source; B, primary slits; C, double Si(111) monochromator; D, secondary slits in front of a Kirkpatrick–Baez (KB) mirror; E1 and E2, KB mirrors; F: micromanipulator and goniometer. The size and divergence of the beam at the undulator source point and at the focal spot are symbolized by squares. The distance from the source and the beam divergence are indicated.
Figure 2
Figure 2
Schematic design of the goniometer setup during sample alignment. (a) Overall view; (b) close-up of the sample environment. Components: A, mirror chamber; B1, ionization chamber; B2, guard aperture support; B3, beam stop; C, cryoflow; D, microscope objectives; E, MAR 165 CCD; F, sample support; G, micromanipulator; H, xy sample stage; I1–I3, xyz sample positioner. For data collection the microscope is translated vertically into a home position and the MAR CCD is translated to a chosen distance from the sample.
Figure 3
Figure 3
Crystal/beam relationship. (a) Large and small crystals used for data collection with dimensions of 180 × 180 × 30 and 20 × 20 × 70 µm, respectively; 1 µm beam spot. (b) Strategy for data acquisition. After every rotation, new material is present in the narrow beam channel. A small intentional misset (2–5 µm) of the rotation axis was introduced. During data collection this creates a cylinder around the rotation centre, with the multiply illuminated area lying on the surface of the cylinder. Consequently, this minimizes the inclusion of damaged crystal volume contributing to individual diffraction patterns during total exposure.
Figure 4
Figure 4
Diffraction pattern of xylanase II. (a), (b), (c): Spot shapes for reflections of high, medium and low resolution, respectively, with different magnitude of counts. (d), (e), (f): Normalized standard profiles (background pixels, 0; peak pixels are shown as a histogram within the range {1–9, A–Z}) accumulated in MOSFLM from spots of several adjacent images within a certain detector area. The detector pixel size is 78.94 × 78.94 µm. The shape of low- and medium-resolution spots is mainly defined by the detector point-spread function. Average profiles do not adequately fit the individual spot shape for strong spots at low resolution, therefore in this resolution range integration by summation of pixels is superior to profile fitting. A weighted integration scheme described in the text was used to find the best compromise.
Figure 5
Figure 5
Xylanase II structure. Left, secondary structure with selected residues; right, selected residues with 1.5 Å resolution σA-weighted 2F oF c electron-density map contoured at 0.7 e Å−3 level. The excellent densities for beam-sensitive residues, for example glutamic acids, tyrosines and methionine, provide no evidence of radiation damage.
Figure 6
Figure 6
Irradiated crystal volume (V cryst) scaled against scattering power (S) for a selected high-resolution single-crystal microdiffraction experiment (adapted from Riekel et al., 2005 ▶). The scattering power has been scaled to an average electron density: S = (F 000/V cell)2 × λ3 × V 32 cryst, where F 000 is the zero-order structure factor, V cell is the unit-cell volume, λ is the wavelength and V cryst is the crystal volume. For experiments with a beam size smaller than the crystal size, V cryst corresponds to the irradiated volume during a single exposure. The shaded zone indicates the previously predicted crystal-volume limit for protein crystallography. Open squares represent inorganic structures: 1, CaF2 (Burghammer, 1997 ▶); 2, kaolimite (Neder et al., 1996 ▶); 3, birnessite (Gaillot et al., 2003 ▶). Filled diamonds represent protein crystals: X, xylanase II; 4, rhodopsin (Li et al., 2004 ▶); 5, α-amylose (Popov et al., 2006 ▶); 6, amyloid-like fibrils (Nelson et al., 2005 ▶); 7, sensory rhodopsin II (Luecke et al., 2001 ▶); 8, bacteriorhodopsin (Pebay-Peyroula et al., 1997 ▶); 9, HIV-1 capsid protein (p24; Berthet-Colominas et al., 1999 ▶); 10: integrin α2β1-binding collagen peptide (Emsley et al., 2004 ▶).
Figure 7
Figure 7
Calculated small beam enhancement, defined as the ratio of the total energy deposited in the crystal relative to that actually deposited in the beam volume, as a function of the beam diameter for incident X-ray energies of 8.1 keV (dashed line), 12.7 keV (unbroken line) and 15 keV (dotted line). The inset shows the calculated deposited energy density per generated 12.7 keV photoelectron as a function of radius for a 20 µm thick sample illuminated by a 1 µm diameter beam. On average, 12.1 keV is deposited in the whole crystal but only 1.4 keV of this is contained within the illuminated volume (indicated by the shading).

References

    1. Berthet-Colominas, C., Monaco, S., Novelli, A., Sibai, G., Mallet, F. & Cusack, S. (1999). EMBO J.18, 1124–1136. - PMC - PubMed
    1. Brünger, A. T., Adams, P. D., Clore, G. M., DeLano, W. L., Gros, P., Grosse-Kunstleve, R. W., Jiang, J.-S., Kuszewski, J., Nilges, M., Pannu, N. S., Read, R. J., Rice, L. M., Simonson, T. & Warren, G. L. (1998). Acta Cryst. D54, 905–921. - PubMed
    1. Burghammer, M. (1997). PhD thesis, LMU.
    1. Burmeister, W. P. (2000). Acta Cryst. D56, 328–341. - PubMed
    1. Clarke, J. H., Davidson, K., Rixon, J. E., Halstead, J. R., Fransen, M. P., Gilbert, H. J. & Hazlewood, G. P. (2000). Appl. Microbiol. Biotechnol.53, 661–667. - PubMed

Publication types