

Spatiotemporal expression of Dexras1 after spinal cord transection in rats
- PMID: 18219571
- PMCID: PMC11515033
- DOI: 10.1007/s10571-007-9253-y
Spatiotemporal expression of Dexras1 after spinal cord transection in rats
Abstract
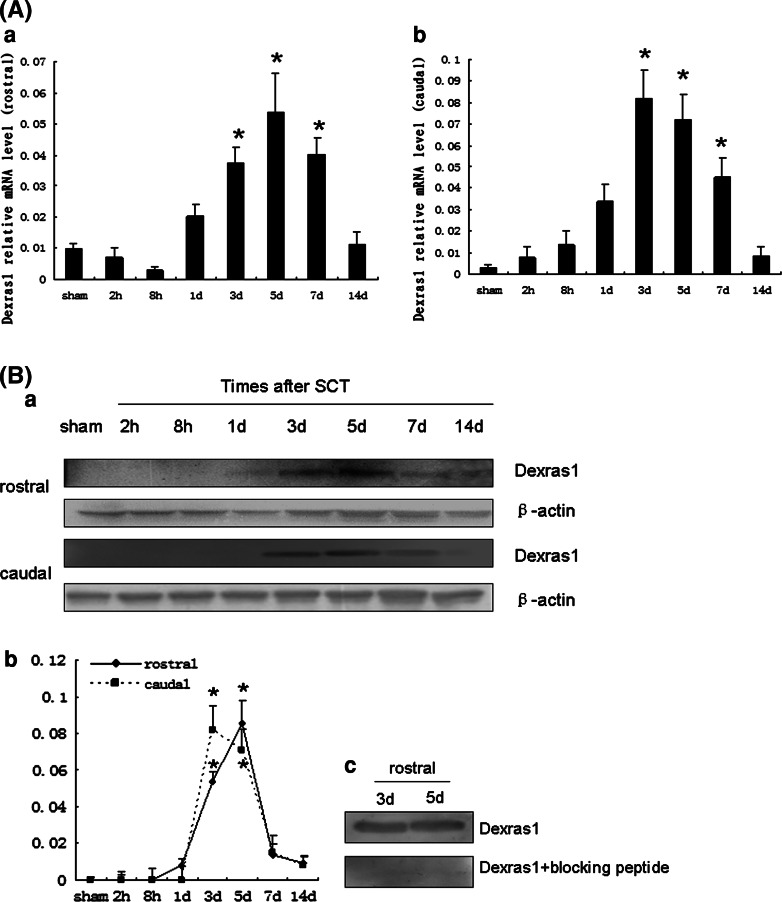
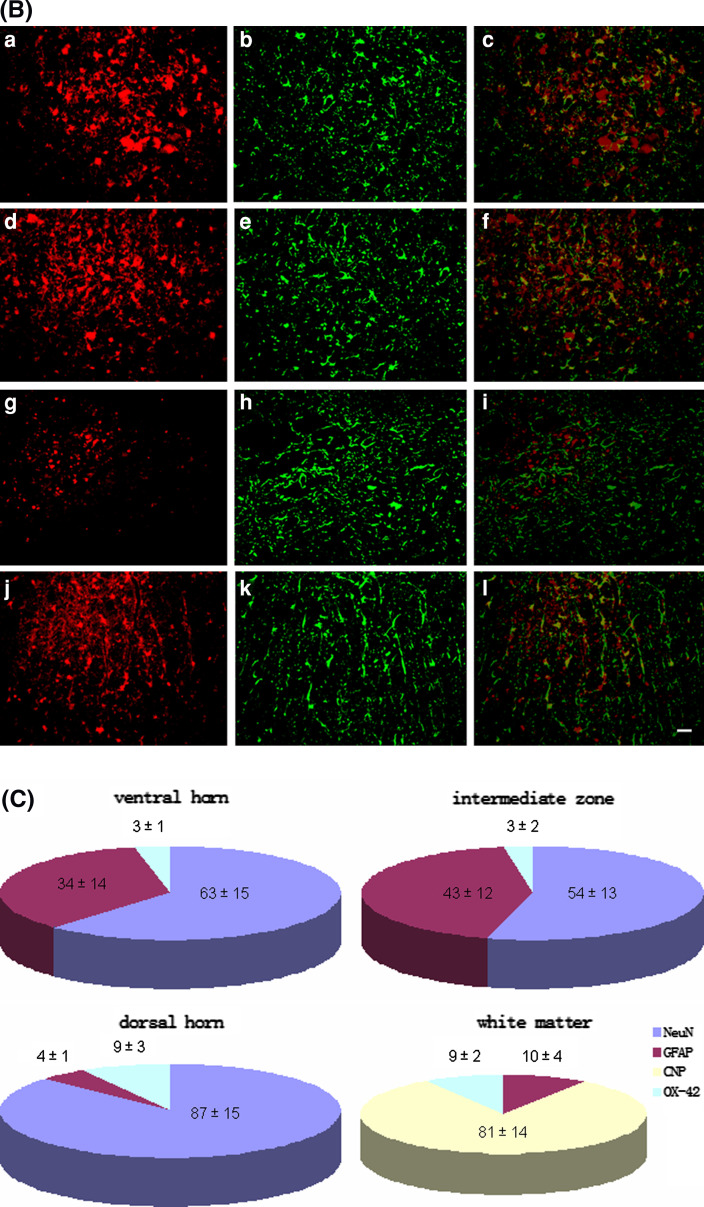
Dexras1, a brain-enriched member of the Ras subfamily of GTPases, as a novel physiologic nitric oxide (NO) effector, anchor neuronal nitric oxide synthase (nNOS) that increased after spinal cord injury (SCI), to specific targets to enhance NO signaling, and is strongly and rapidly induced during treatment with dexamethasone. It is unknown how the central nervous system (CNS) trauma affects the expression of Dexras1. Here we used spinal cord transection (SCT) model to detect expression of Dexras1 at mRNA and protein level in spinal cord homogenates by real-time PCR and Western blot analysis. The results showed that Dexras1 mRNA upregulated at 3 day, 5 day, and 7 day significantly (P < 0.05) that was consistent with the protein level except at 7 day. Immunofluorescence revealed that both neurons and glial cells showed Dexras1 immunoreactivivty (IR) around SCT site, but the proportion is different. Importantly, injury-induced expression of Dexras1 was co-labeled by caspase-3 (apoptotic marker) and Tau-1 (marker for pathological oligodendrocyte). Furthermore, colocalization of Dexras1, carboxy-terminal PSD95/DLG/ZO-1 (PDZ) ligand of nNOS (CAPON) and nNOS was observed in neurons and glial cells, supporting the existence of ternary complexes in this model. Thus, the results that the transient high expression of Dexras1 which localized in apoptotic neurons and pathological oligodendrocytes might provide new insight into the secondary response after SCT.
Figures


Similar articles
-
Light-induced retinal ganglion cell damage in vivo involves Dexras1.Mol Vis. 2011 Jan 13;17:134-43. Mol Vis. 2011. PMID: 21245950 Free PMC article.
-
Changes in mRNA for CAPON and Dexras1 in adult rat following sciatic nerve transection.J Chem Neuroanat. 2008 Jan;35(1):85-93. doi: 10.1016/j.jchemneu.2007.07.004. Epub 2007 Jul 31. J Chem Neuroanat. 2008. PMID: 17768032
-
Spatiotemporal patterns of dexamethasone-induced Ras protein 1 expression in the central nervous system of rats with experimental autoimmune encephalomyelitis.J Mol Neurosci. 2010 May;41(1):198-209. doi: 10.1007/s12031-009-9322-4. Epub 2010 Jan 19. J Mol Neurosci. 2010. PMID: 20084551
-
Expression of CAPON after spinal cord injury in rats.J Mol Neurosci. 2008 Feb;34(2):109-19. doi: 10.1007/s12031-007-9019-5. Epub 2007 Dec 12. J Mol Neurosci. 2008. PMID: 18074109
-
Dexras1: a G protein specifically coupled to neuronal nitric oxide synthase via CAPON.Neuron. 2000 Oct;28(1):183-93. doi: 10.1016/s0896-6273(00)00095-7. Neuron. 2000. PMID: 11086993
Cited by
-
Light-induced retinal ganglion cell damage in vivo involves Dexras1.Mol Vis. 2011 Jan 13;17:134-43. Mol Vis. 2011. PMID: 21245950 Free PMC article.
-
Small G Proteins Dexras1 and RHES and Their Role in Pathophysiological Processes.Int J Cell Biol. 2014;2014:308535. doi: 10.1155/2014/308535. Epub 2014 Mar 20. Int J Cell Biol. 2014. PMID: 24817889 Free PMC article. Review.
-
Mettl14-mediated m6A modification modulates neuron apoptosis during the repair of spinal cord injury by regulating the transformation from pri-mir-375 to miR-375.Cell Biosci. 2021 Mar 11;11(1):52. doi: 10.1186/s13578-020-00526-9. Cell Biosci. 2021. PMID: 33706799 Free PMC article.
-
Human umbilical cord blood cells directly suppress ischemic oligodendrocyte cell death.J Neurosci Res. 2009 Feb;87(2):333-41. doi: 10.1002/jnr.21857. J Neurosci Res. 2009. PMID: 18924174 Free PMC article.
References
-
- Abe Y, Yamamoto T, Sugiyama Y, Watanabe T, Saito N, Kayama H, Kumagai T (1999) Apoptotic cells associated with Wallerian degeneration after experimental spinal cord injury: a possible mechanism of oligodendroglial death. J Neurotrauma 16:945–952 - PubMed
-
- Arundine M, Tymianski M (2003) Molecular mechanisms of calcium-dependent neurodegeneration in excitotoxicity. Cell Calcium 34(4–5):325–137 - PubMed
-
- Bizzoco E, Vannucchi MG, Faussone-Pellegrini MS (2007) Transient ischemia increases neuronal nitric oxide synthase, argininosuccinate synthetase and argininosuccinate lyase co-expression in rat striatal neurons. Exp Neurol 204:252–259 - PubMed
Publication types
MeSH terms
Substances
LinkOut - more resources
Full Text Sources
Medical
Molecular Biology Databases
Research Materials
