. 2009 Feb;30(2):553-74.
doi: 10.1002/hbm.20524.

Self-organized criticality and the development of EEG phase reset

Affiliations

Self-organized criticality and the development of EEG phase reset

Robert Wayne Thatcher et al. Hum Brain Mapp. 2009 Feb.

Abstract

Objectives: The purpose of this study was to explore human development of self-organized criticality as measured by EEG phase reset from infancy to 16 years of age.

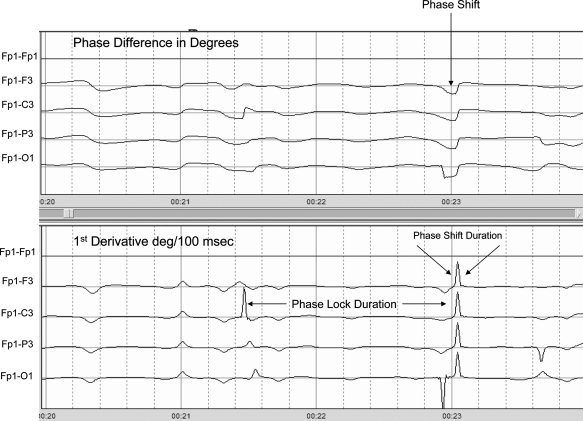
Methods: The electroencephalogram (EEG) was recorded from 19 scalp locations from 458 subjects ranging in age from 2 months to 16.67 years. Complex demodulation was used to compute instantaneous phase differences between pairs of electrodes and the 1st and 2nd derivatives were used to detect the sudden onset and offset times of a phase shift followed by an extended period of phase locking. Mean phase shift duration and phase locking intervals were computed for two symmetrical electrode arrays in the posterior-to-anterior locations and the anterior-to-posterior directions in the alpha frequency band (8-13 Hz).

Results: Log-log spectral plots demonstrated 1/f (alpha) distributions (alpha approximately 1) with longer slopes during periods of phase shifting than during periods of phase locking. The mean duration of phase locking (150-450 msec) and phase shift (45-67 msec) generally increased as a function of age. The mean duration of phase shift declined over age in the local frontal regions but increased in distant electrode pairs. Oscillations and growth spurts from mean age 0.4-16 years were consistently present.

Conclusions: The development of increased phase stability in local systems is paralleled by lengthened periods of unstable phase in distant connections. Development of the number and/or density of synaptic connections is a likely order parameter to explain oscillations and growth spurts in self-organized criticality during human brain maturation.


Figures

Figure 1
Figure 1
Experimental design. Left head diagram shows the location of electrodes for the computation of coherence and phase differences in the anterior‐to‐posterior direction. Right head diagram shows the location of electrodes in the posterior‐to‐anterior direction. Local distances (6 cm) are in adjacent electrode combinations (O1/2‐P3/4 and Fp1/2‐F3/4). Longest distance (24 cm) electrode combinations are Fp1/2‐O1/2.
Figure 2
Figure 2
Illustrations of phase reset. Left is the unit circle in which there is a clustering of phase angles and thus high coherence as measured by the length of the unit vector r. The top row is an example of phase reduction and the top right is a time series of the approximated 1st derivative of the instantaneous phase differences for the time series t 1, t 2, t 3, t 4 at mean phase angle = 45° and t 5,t 6,t 7, t 8 at mean phase angle = 10°. The vector r1 = 45° occurs first in time and the vector r2 = 10° and 135° (see bottom left) occurs later in time. Phase reset is defined by a sudden change in phase difference followed by a period of phase locking. The onset of Phase Reset is between time point 4 and 5 where the 1st derivative is a maximum. The 1st derivative near zero is when there is phase locking and little change in phase difference over time. The bottom row is an example of phase advancement and the bottom right is the 1st derivative time series. The sign or direction of phase reset is arbitrary since two oscillating events are being brought into phase locking and represent a stable state as measured by the 1st derivative independent of direction.
Figure 3
Figure 3
Diagram of phase reset metrics. Phase shift (PS) onset was defined at the time point when a significant 1st derivative occurred (≥5°/csec) followed by a peak in the 2nd derivative and a peak in the 1st derivative, phase shift duration (SD) was defined as the time from onset of the phase shift defined by the positive peak of the 2nd derivative to the offset of the phase shift defined by the negative peak of the 2nd derivative. The phase locking interval (LI) was defined as the interval of time between the onset of a phase shift and the onset of a subsequent phase shift. Phase reset (PR) is composed of two events: (1) a phase shift and (2) a period of locking following the phase shift where the 1st derivative ≈ 0 or PR = SD + LI.
Figure 4
Figure 4
Example from one subject. Top are the EEG phase differences between Fp1‐F3, Fp1‐C3, Fp1‐P3 and Fp1‐O1 in degrees. Bottom are the 1st derivatives of the phase differences in the top traces in degrees/centiseconds. A 1st derivative ≥5°/csec marked the onset of a phase shift and an interval of time following the phase shift where the 1st derivative ≈ 0 defined the phase locking interval as described in Figure 3.
Figure 5
Figure 5
Examples of the log–log plots of the FFT of the 1st derivatives of EEG phase differences in the anterior‐to‐posterior direction. Solid line is the FFT spectral values and the dotted line is the linear regression fits to the spectral values. Table II shows the slope or α exponents in the 1/fα equation.
Figure 6
Figure 6
Log–log plots of the Fourier analyses of the 1st derivative of phase differences during periods of phase locking versus periods of phase shift in the four different subjects in Figure 5. Solid line is the FFT spectral values and the dotted line is the linear regression fits to the spectral values. A 1/fα distribution is present in all instances in which the slope coefficients were higher for the phase locking periods in comparison to the phase shift periods. Table III shows the differences in slopes and the1/f α coefficients for phase shifting versus phase locking as well as the average α ≈ 1.
Figure 7
Figure 7
Mean EEG phase shift duration from 0.4 to 16.2 years of age. Top row are from the anterior‐to‐posterior electrode combinations and bottom row are from the posterior‐to‐anterior electrode combinations (see Fig. 1). The left column is from the left hemisphere and the right column is from the right hemisphere. It can be seen that phase shift duration increases in most electrode combinations but decreases in the short inter‐electrode distance (6 cm) in the anterior‐to‐posterior direction.
Figure 8
Figure 8
Mean EEG phase locking intervals from 0.4 to 16.2 years of age. Top row are from the anterior‐to‐posterior electrode combinations and bottom row are from the posterior‐to‐anterior electrode combinations (see Fig. 1). The left column is from the left hemisphere and the right column is from the right hemisphere. Growth spurts and oscillations during development are seen. Also, it can be seen that phase locking intervals increase as a function of age in all electrode combinations.
Figure 9
Figure 9
Frequency histograms of phase shift duration (Top) and phase lock duration (Bottom) from 215 subjects between 10 and 16.67 years of age. 6 cm anterior‐to‐posterior (AP) interelectrode distance, 6 cm interelectrode distance for posterior‐to‐anterior direction (PA) and the long (24 cm) inter electrode distance which is the same for AP and PA (see fig. 1). Left and right hemispheres were averaged together. The y‐axis is the number of subjects and the x‐axis is msec.
Figure 10
Figure 10
Fourier spectral analyses of the developmental trajectories of phase shift duration from 0.4 years to 16.2 years of age in short (6 cm) (dashed line) and long (24 cm) (short line) inter‐electrode distances in the anterior‐to‐posterior and posterior‐to‐anterior directions. Magnitude is on the y‐axis and frequency on the x‐axis. Distant inter‐electrodes exhibited greater power in the anterior‐to‐posterior direction while local connections exhibited the greater power in the posterior‐to‐anterior direction.
Figure 11
Figure 11
Fourier spectral analyses of the developmental trajectories of mean phase locking from 0.4 years to 16.2 years of age in short (6 cm) (dashed line) and long (24 cm) (solid line) inter‐electrode distances in the anterior‐to‐posterior and posterior‐to‐anterior directions. Magnitude is on the y‐axis and frequency on the x‐axis. The greatest spectral energy was in the short distance inter‐electrodes (6 cm) in the posterior‐to‐anterior direction.

Similar articles

Cited by

References

    1. Allport DA ( 1968): Phenomenal simultaneity and perceptual moment hypotheses. Br J Psychol 59: 395–406. - PubMed
    1. Bak P ( 1996): How Nature Works: The Science of Self‐Organized Criticality. New York: Springer‐Verlag.
    1. Bak P,Tang C,Wisenfeld K ( 1987): Self‐organized criticality: An explanation of 1/f noise. Phys Rev Lett 59: 381–384. - PubMed
    1. Bak P,Tang C,Wisenfeld K ( 1988): Self‐organized criticality. Phys Rev A 38: 364–374. - PubMed
    1. Beggs JM,Plenz D ( 2003): Neuronal avalanches in neocortical circuits. J Neurosci 23: 11167–11177. - PMC - PubMed

MeSH terms