Review
. 2008 Feb;27(2):376-90.
doi: 10.1002/jmri.21265.

MR thermometry

Affiliations
Review

MR thermometry

Viola Rieke et al. J Magn Reson Imaging. 2008 Feb.

Abstract

Minimally invasive thermal therapy as local treatment of benign and malignant diseases has received increasing interest in recent years. Safety and efficacy of the treatment require accurate temperature measurement throughout the thermal procedure. Noninvasive temperature monitoring is feasible with magnetic resonance (MR) imaging based on temperature-sensitive MR parameters such as the proton resonance frequency (PRF), the diffusion coefficient (D), T1 and T2 relaxation times, magnetization transfer, the proton density, as well as temperature-sensitive contrast agents. In this article the principles of temperature measurements with these methods are reviewed and their usefulness for monitoring in vivo procedures is discussed. Whereas most measurements give a temperature change relative to a baseline condition, temperature-sensitive contrast agents and spectroscopic imaging can provide absolute temperature measurements. The excellent linearity and temperature dependence of the PRF and its near independence of tissue type have made PRF-based phase mapping methods the preferred choice for many in vivo applications. Accelerated MRI imaging techniques for real-time monitoring with the PRF method are discussed. Special attention is paid to acquisition and reconstruction methods for reducing temperature measurement artifacts introduced by tissue motion, which is often unavoidable during in vivo applications.


Figures

Figure 1
Figure 1
Maximum temperature (left) and thermal dose map (middle) from temperature measurements during in vivo canine prostate ablation with transurethral ultrasound show good agreement with the post-treatment contrast-enhanced image (right).
Figure 2
Figure 2
T1-weighted gradient echo images acquired during RF-ablation of an ex vivo tissue sample, showing signal decrease in the heated region.
Figure 3
Figure 3
Patient with relapse metastasis from a colorectal carcinoma. The T1-weighted thermosensitive gradient echo sequence (TR/TE/flip angle: 102/8 ms/15) shows the metastasis before starting the laser ablation (a). The same imaging sequence in an advanced phase (18th minute) of the intervention shows a clear drop in signal intensity in the heated area (b). The contrast enhanced T1-weighted spin echo sequence (c) shows the immediate expansion of the necrosis and documents the complete ablation of the tumor tissue. (From: Vogl TJ, Straub R, Zangos S, Mack MG, Eichler K. MR-guided laser-induced thermotherapy (LITT) of liver tumors: experimental and clinical data. Int J Hyperthermia 2004;20:713–724. Reprinted with permission.)
Figure 4
Figure 4
Line scan ADC trace maps of the canine prostate during thermal ablation with a transurethral ultrasound applicator. Image (a) shows the ADC trace map before heating started. During heating (b), diffusion increases (arrow) due to increasing temperature. When tissue coagulation occurs, diffusion decreases although the temperature is still high (c); the arrow shows the dip inside the heating zone. After cooling back to body temperature (d), diffusion in the coagulated region remains low (arrow).
Figure 5
Figure 5
Images and temperature measurement during MRI-guided focused ultrasound thermal ablation of a uterine fibroid. A: Thermal dose maps estimated from the MR thermometry acquired during treatment. Thresholds of 18 and 240 equivalent min at 43°C are shown. B–C: Coronal post-treatment contrast-enhanced T1-weighted MR images in the focal plane acquired immediately after contrast injection (B) and five min later (C). The affected fibroid tissue and non-perfused volume are larger than would be expected from the thermal measurements, presumably due to vessel occlusion during the treatment. D: Sagittal contrast-enhanced T1-weighted image (along the direction of the ultrasound beam). E–F: Thermal images acquired during two sonications in this fibroid with imaging oriented in the focal plane (E) and along the ultrasound beam direction (F). Based on the thermal dose, the lesion volume for these 20s sonication was approximately 0.7 cm3 G: Temperature distribution through the focus at peak temperature rise for the two sonications in E–F. (images courtesy by Nathan McDannold)
Figure 6
Figure 6
Temperature measurements during in vivo canine prostate ablation. The image was acquired after the thermal treatment ended and the temperature in the prostate returned to body temperature. Thus, the apparent heating areas are caused by tissue motion and resulting misregistration between the image and its baseline.
Figure 7
Figure 7
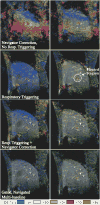
Two time frames during laser heating in the liver of a pig under variable respiratory motion. Reconstructions were performed without trigger (top row), with simple respiratory triggering only (second row), respiratory triggering with navigator phase correction (third row), and the triggered, navigated, multi-baseline method (bottom row). (From Vigen KK, Daniel BL, Pauly JM, Butts K. Triggered, navigated, multi-baseline method for proton resonance frequency temperature mapping with respiratory motion. Magn Reson Med 2003;50:1003–10. Reprinted with permission.)
Figure 8
Figure 8
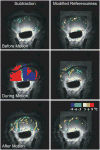
Temperature images acquired in the canine prostate without application of heat comparing referenceless thermometry and baseline subtraction. Before motion, the temperature maps are similar (upper row). When tissue motion occurs (middle row), severe errors render baseline subtraction useless. After motion (bottom row), small artifacts remain with baseline subtraction but are nor as prevalent in the referenceless method. (From Rieke V, Kinsey AM, Ross AB, Nau WH, Diederich CJ, Sommer G, Butts Pauly K. Referenceless MR thermometry for monitoring thermal ablation in the prostate. IEEE Trans Med Imaging 2007;26:813–821. Reprinted with permission.)

Similar articles

Cited by

References

    1. Kim JH, Hahn EW. Clinical and biological studies of localized hyperthermia. Cancer Res. 1979;39:2258–2261. - PubMed
    1. Thomsen S. Pathologic analysis of photothermal and photomechanical effects of laser-tissue interactions. Photochem Photobiol. 1991;53:825–835. - PubMed
    1. Sapareto SA, Dewey WC. Thermal dose determination in cancer therapy. Int J Radiat Oncol Biol Phys. 1984;10:787–800. - PubMed
    1. Dewhirst MW, Viglianti BL, Lora-Michiels M, Hanson M, Hoopes PJ. Basic principles of thermal dosimetry and thermal thresholds for tissue damage from hyperthermia. Int J Hyperthermia. 2003;19:267–294. - PubMed
    1. Mack MG, Straub R, Eichler K, Engelmann K, Zangos S, Roggan A, Woitaschek D, Bottger M, Vogl TJ. Percutaneous MR imaging-guided laser-induced thermotherapy of hepatic metastases. Abdom Imaging. 2001;26:369–374. - PubMed

Publication types

MeSH terms